June 30, 2020

Why We’re Blind to Probability

Most people get that certainties are rare, and the best you can do is make decisions where the odds are in your favor. They understand you can be smart and end up wrong, or dumb and end up right, because that’s how luck and risk work.

But almost no one actually uses probability in the real world, especially when judging others’ success.

Most of what people care about is, “Were you right or wrong?”

Probability is about nuance and gradation. But in the real world people pay attention to black and white.

If you said something will happen and it happens, you were right.

If you said it will happen and it doesn’t, you’re wrong.

That’s how people think, because it doesn’t take much effort to think it.


NIFTY intraday charts

5 min charts


NIFTY EOD charts

- nifty closed flat at 10302
- AD was 4:5

- range compression as we near end of rising wedge

- NIFTY PE ratio is 26
- would love to see how it changes with this quarterly results 


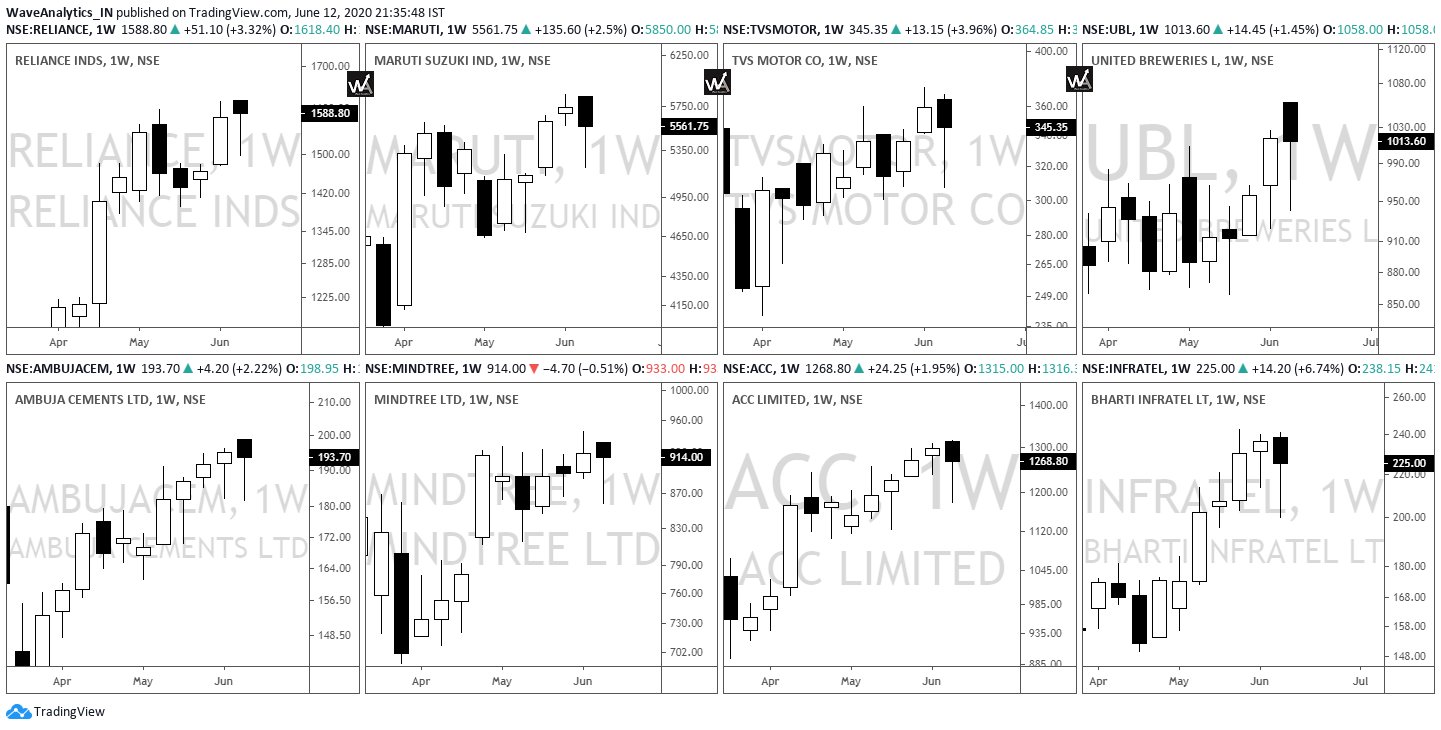
Candlesticks basics

Image

June 29, 2020

NIFTY intraday charts


5 min charts:
- ignored first short signal as bar was green
- took short as per arrow... stopped out at tiny loss
- ignored first long signal as bar did not close near high
- did nothing thereafter


15 min charts:
- short trade stopped out


NIFTY EOD charts

- nifty continues to trade within rising wedge
- today nifty closed 0.7% in negative at 10312
- AD was 1:2

- trading range was extremely narrow 


June 28, 2020

NIFTY bar charts multiple timeframes

Sometimes, bar charts provide a very neat and clean look...

15 min charts:
- here support is  clearly seen at 10200 and resistance at 10350 F

June 27, 2020

BANKNIFTY charts

- breakout failure above 22000
- support 20000


NIFTY weekly charts

- spinning top
- indecision between bulls and bears
- weakness if 10000 breaks

Image

Video: Expiry day trading strategy (Hindi)


June 26, 2020

NIFTY intraday charts (spot)

5 min charts:


NIFTY EOD charts

- markets trading within rising wedge
- today nifty closed 1% in positive at 10383
- AD was 5:4

- VIX down 4% to 29

- ATR now 223 (14 day)
- support 10000


A 50% win rate is all you need

A 50% win rate with solid risk management is all you need to succeed

50 wins × Rs 1000 = +Rs 50,000
50 losses × Rs 500 = -Rs 25,000

100 trades with a 50% win rate and 2:1 reward to risk nets +Rs 25,000

Every trade must be taken with this concept in mind. 

Embrace small losses

Indian citizens giving stimulus to the government?


June 25, 2020

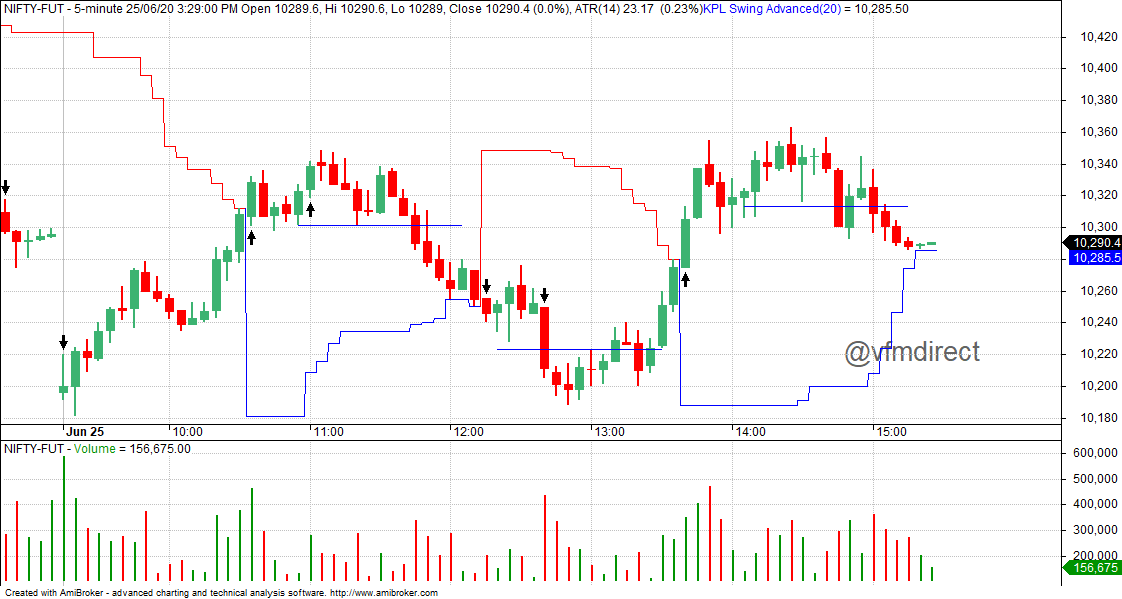
NIFTY intraday charts

5 min charts:
- ignored first short trade as there was buying
- next long and short trade stopped out at tiny loss
- did nothing thereafter

Image

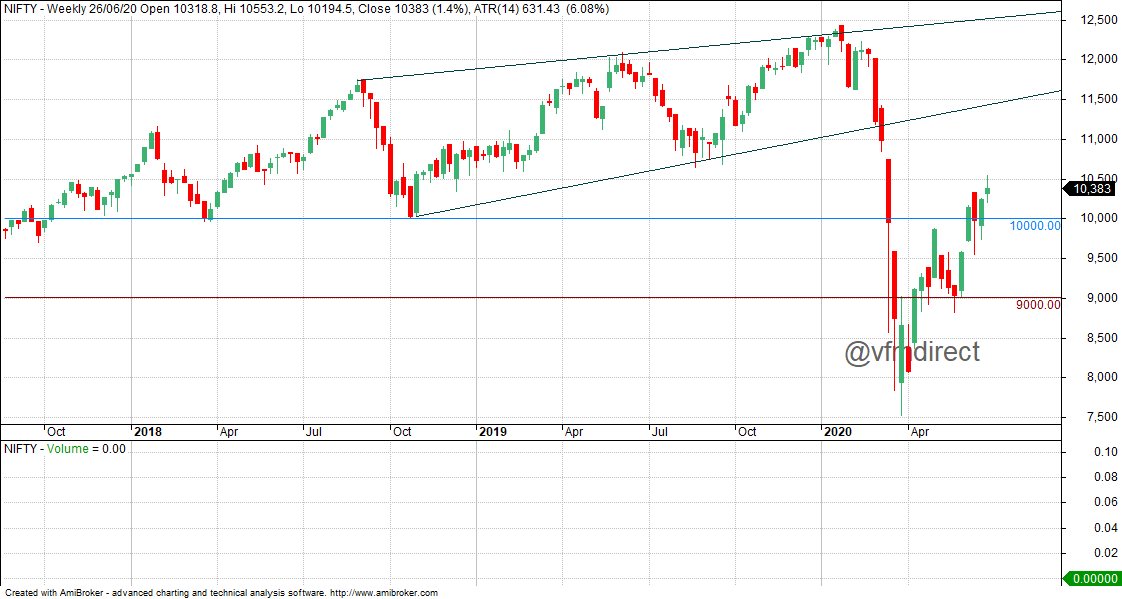
NIFTY EOD charts

- NIFTY is trading within rising wedge
- today markets opened gapup down but closed flat at 10289
- AD was 5:4

- gapdown was because of prev day engulfing bar
- and bad global clues
- but the first bar saw lot of buying trapping the new short traders

- trading range was limited to 10200-10350

- going forward, I expect the lower trendline to offer support
- difficult to assign a value to this


June 24, 2020

NIFTY intraday charts

5 min charts with kplswing indicator:
- 4 trades... all breakeven or small profits
- break of 10350 was only profitable trade

NIFTY EOD charts

- nifty continues to trade within the rising wedge
- today nifty reversed from upper trendline
- close was 1.6% in negative at 10305

- bearish engulfing bar formed

- AD was 8:11

- support 10000 resistance 11000


AllStarCharts: RELIANCE has 35% more upside

While I am seeing limited upsides in RELIANCE due to a huge expanding triangle, Tom Bruni of AllStarCharts sees another 35% upside.

>>>
Suggesting that Reliance Industries could rise another 35% from current levels may seem like a bold call, especially since it has doubled off the March lows. But when you consider our thesis that Equities are in the midst of a new Bull Market then it makes sense that the largest stock in the market would be leading the charge.

And with relative strength hitting new highs and our risk well-defined on an absolute basis, even if we’re wrong the reward/risk is so skewed in our favor that any losses are small enough relative to the potential reward to warrant putting on the trade.

The bottom line is, if Reliance Industries is above 1,600 we want to be long with a 6-month target up near 2,340.
<<<

The curious case of GLENMARK Pharma

  • Favipiravir drug cannot change the fortunes of Glenmark Pharmaceuticals in terms of revenue or profits. So if you do want to buy or sell the stock, do your own research on the total business of the company.
  • Just because a company is covered by all news sources does not make it a great buy. Do your own research.
  • Even with a 5-6% of the company getting traded in a day and not a buy name in the bulk deals and hardly any Mutual Fund ownership suggests there is no major institutional interest in the company. ( We will know more when the quarterly shareholding pattern comes out. )
  • Would be interesting to see who bought the 25-40% pop. Was it retail or institutions. Will wait for the Quarterly shareholding and Mutual Fund Factsheets post current month.
  • I have no major view on the stock price but a simple technical take would be the opening and low price of 450 on the announcement day is important. If it does not hold up it makes the technical trend negative. A fresh look technically if it can sustain above the highs of 550-570. But preference would be to do nothing
  • No Positions on the stock or understanding of the company just a view based on publicly available price and volume data. Do your own research – Not a recommendation to buy or sell.

NIFTY nearing top?


June 23, 2020

Stocks at 52 week high

AARTIDRUGS

AARTIDRUGS chart

BANKNIFTY finally manages a close above 22000


NIFTY EOD charts

- nifty closed 1.5% in positive at 10471
- AD was 5:2

- new buy signal today
- the previous one failed
- as usual, keep SL around 5 bar low or twice the ATR (233 today)


June 22, 2020

Stocks at all time high

AARTIDRUGS

AARTIDRUGS chart

RELIANCE Big Boss


NIFTY EOD charts

- nifty trading within rising wedge
- today close was 0.7% in positive at 10311
- AD was 2:1

- trading range was very small
- small doji formed


June 20, 2020

BANKNIFTY charts

- trading in a range
- stiff resistance 22000

- above this, next resistance 24000


Weekly charts


RELIANCE charts - a new perspective

The stock has doubled in 3 months... this is rare for an index heavyweight

June 19, 2020

NIFTY intraday charts


NIFTY EOD charts

- nifty is rangebound between 9500 and 10500
- today markets closed 1.5% in positive at 10244
- AD was 2:1

- VIX dropped 5% to 30

- rising wedge seen on charts
- this limits upside to 10500-10600 (upper trendline)
- break of lower trendline will lead to a big correction

- nifty PE ratio is around 25


NIFTY PE ratio at 25


BANKNIFTY breakout


Stocks at all time high

ADANIGREEN

ADANIGREEN chart

June 18, 2020

NIFTY intraday charts

5 min charts:

SL 10030-10050 

NIFTY EOD charts

- nifty is trading in range between 9500 and 10500

- today nifty closed 2% in positive at 10091
- AD was 3:1
- VIX dropped 5% to 32


June 17, 2020

NIFTY intraday charts

5 min charts:
- rangebound day
- nifty failed to sustain above first hour high
- big no 10000 provided strong resistance


15 min charts:
- no signal today


NIFTY EOD charts

- markets rangebound between 9500 and 10500

- today nifty closed 0.3% in negative at 9881
- AD was 5:4

- trading range was 170 points

- 2 days hammer action did not lead to any buying
- it was more of sell on any bounce

- tomorrow is weekly options expiry
- expiry likely to be below 10000


June 16, 2020

Stocks at 52 week high

ADANIGREEN

ADANIGREEN chart

NIFTY intraday charts

5 min charts:

Market outlook

Daily charts:
- market rangebound between 9500 and 10500
- today markets opened gap up and sold off immediately
- at one point, markets were in negative

- intraday trading range was 300+ points
- close was 1% in positive at 9914

- AD was 4:5

- we have hammer formation for 2nd consecutive day
- in a rising market, hammers are a problem as they show selling
- on weekly we have a huge hammer or  a hanging man


Global Equities Could Be Topping Out Again

The intensity of the downside follow-through after this reversal occurs typically provides some insight into whether it marked a short-term top or is the beginning of something much more significant. The ability of buyers to reclaim control and close that gap quickly, however, would be a data point that reaffirms the uptrend’s strength.

And so the point of explaining all this is because we’re seeing this pattern play out in several indexes around the world, including the Nasdaq 100. Given it incorporates all three of the factors that Equity investors have favored for years: US Stocks, Mega/Large-Cap Stocks, and Growth Stocks…all in one liquid, investable index, it’s no surprise that it was the first to make new all-time highs.

The problem is, in addition to the short-term island reversal in the index, it also closed the week below its February highs…opening up the potential for this to turn into a major failed breakout. The line in the sand is 9,725. Below that level, there’s potential for bad things to happen.

Gap up... long signal stopped out


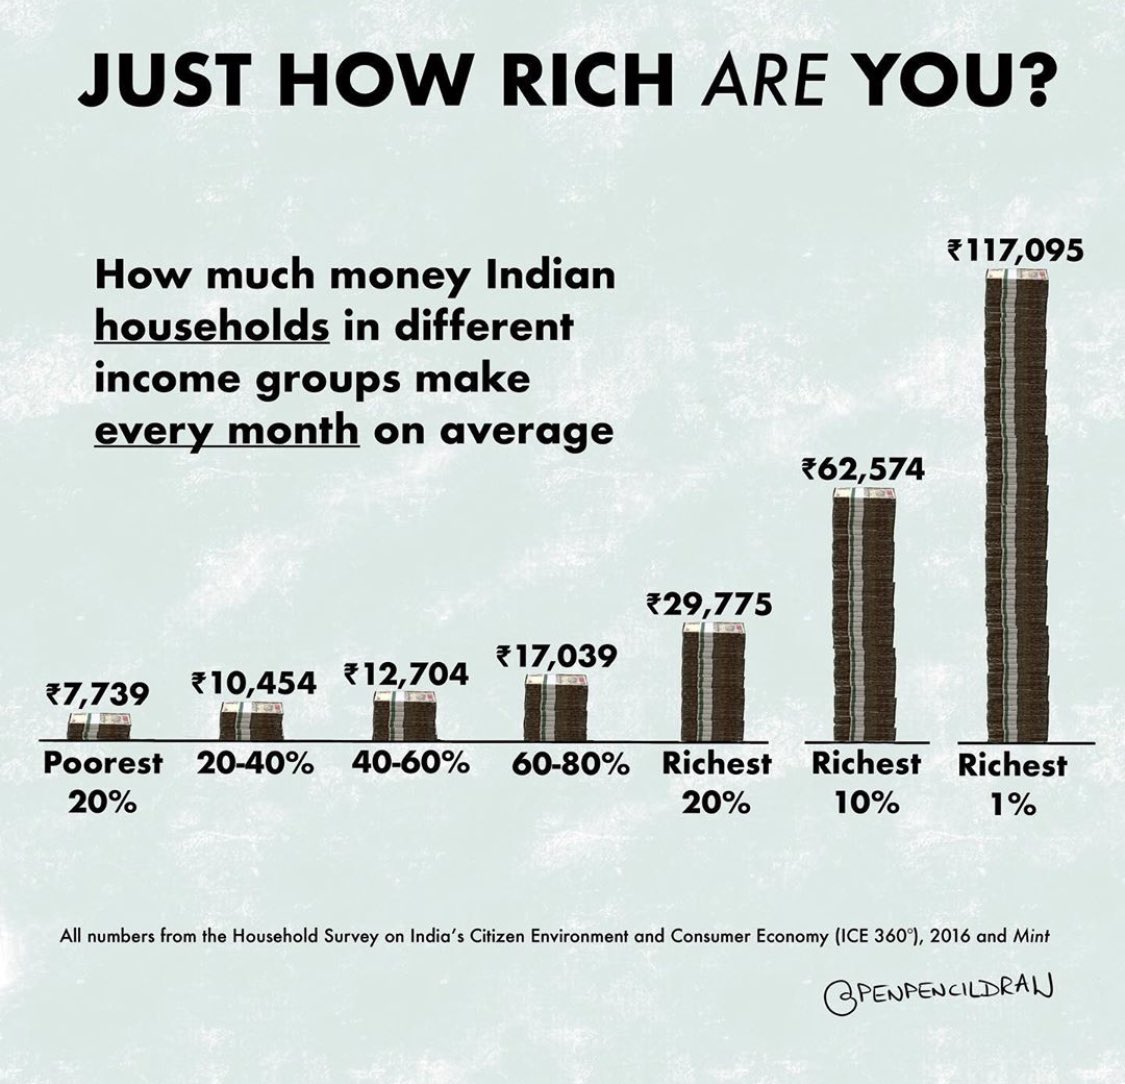
Just how rich are Indians?

Image

June 3, 2020

Market outlook

Due to some problems with blogger, I am posting my comments as a single thread in twitter.


If this works well, I will post everything in twitter and stop using blogger.

My twitter address is https://twitter.com/vfmdirect

No login is required to view the posts... free login required to comment.


NIFTY options range

NIFTY close10062Date3-Jun-2020
VIX30.00%
LevelsStrike priceSignificance
Month Hi10,93311,000Resistance
Week Hi10,48110,500Resistance
Day Hi10,22010,300Resistance
Day Lo9,9049,900Support
Week Lo9,6439,600Support
Month Lo9,1919,100Support
Levels are for day/ week/ month starting tomorrow
Strike price is arrived after rounding up/ down of levels
Range expansion if VIX explodes
For educational purposes only. Not for trading
Updated daily at vfmdirect.in

June 2, 2020

Buy signal on NIFTY index

- signal on kplswing indicator
- the last 2 signals (long and short) failed
- this signal will fail on close below 9500 or trailing 5 bar low

- whatever indicator you use, expect this to fail half the time
- so keep SL tight and let positions run as long as possible


NIFTY options range

NIFTY close9980Date2-Jun-2020
VIX30.00%
LevelsStrike priceSignificance
Month Hi10,84410,900Resistance
Week Hi10,39510,400Resistance
Day Hi10,13710,200Resistance
Day Lo9,8239,800Support
Week Lo9,5659,500Support
Month Lo9,1169,100Support
Levels are for day/ week/ month starting tomorrow
Strike price is arrived after rounding up/ down of levels
Range expansion if VIX explodes
For educational purposes only. Not for trading
Updated daily at vfmdirect.in

June 1, 2020

Market outlook

Daily charts:
- nifty is trading sideways and is now at upper end of trading range
- today nifty opened gapup and closed 2.6% in positive at 9826
- AD was 5:1

- good level for contra traders to be short 
- you are very close to SL (10000)
- I am not a positional trader in nifty 

NIFTY options range

NIFTY close9826Date1-Jun-2020
VIX31.00%
LevelsStrike priceSignificance
Month Hi10,70510,800Resistance
Week Hi10,24810,300Resistance
Day Hi9,98510,000Resistance
Day Lo9,6679,600Support
Week Lo9,4049,400Support
Month Lo8,9478,900Support
Levels are for day/ week/ month starting tomorrow
Strike price is arrived after rounding up/ down of levels
Range expansion if VIX explodes
For educational purposes only. Not for trading
Updated daily at vfmdirect.in

Share this...