LINKS

March 31, 2018

HDFC outlook for markets

Technical forecasting for coming months

• The detailed study of Nifty as per smaller timeframe like daily to a larger timeframe like quarterly, is showing a broader down trended move, with a formation of important top reversal at the all-time high of 11,171 - 29th Jan 18
• The chart pattern of larger timeframe (monthly and quarterly) are signaling a multi-month declines in Nifty, as per thelarger negative sequence of lower tops and bottoms
• Having declined sharply from the all-time highs to the swing low of 9951 levels in the last two months, a decent upside bounce is expected, which could possibly take Nifty towards the high of 10,450 - 10,500 levels, in the month of April or by May 18
• The expected upside bounce could eventually form a new lower top, and we are likely to see a resumption of sharp declines again from the highs, after the completion of lower top
• The ultimate downside target for Nifty could be ~9000 - 8900 levels, which is expected to take 7-9 months from here to form, and that could eventually be an opportunity for bottom fishing in the market.

Read complete report at https://www.hdfcsec.com/hsl.docs//HSL%20Crystal%20Ball%20-%20April%2018-201803311449292491063.pdf
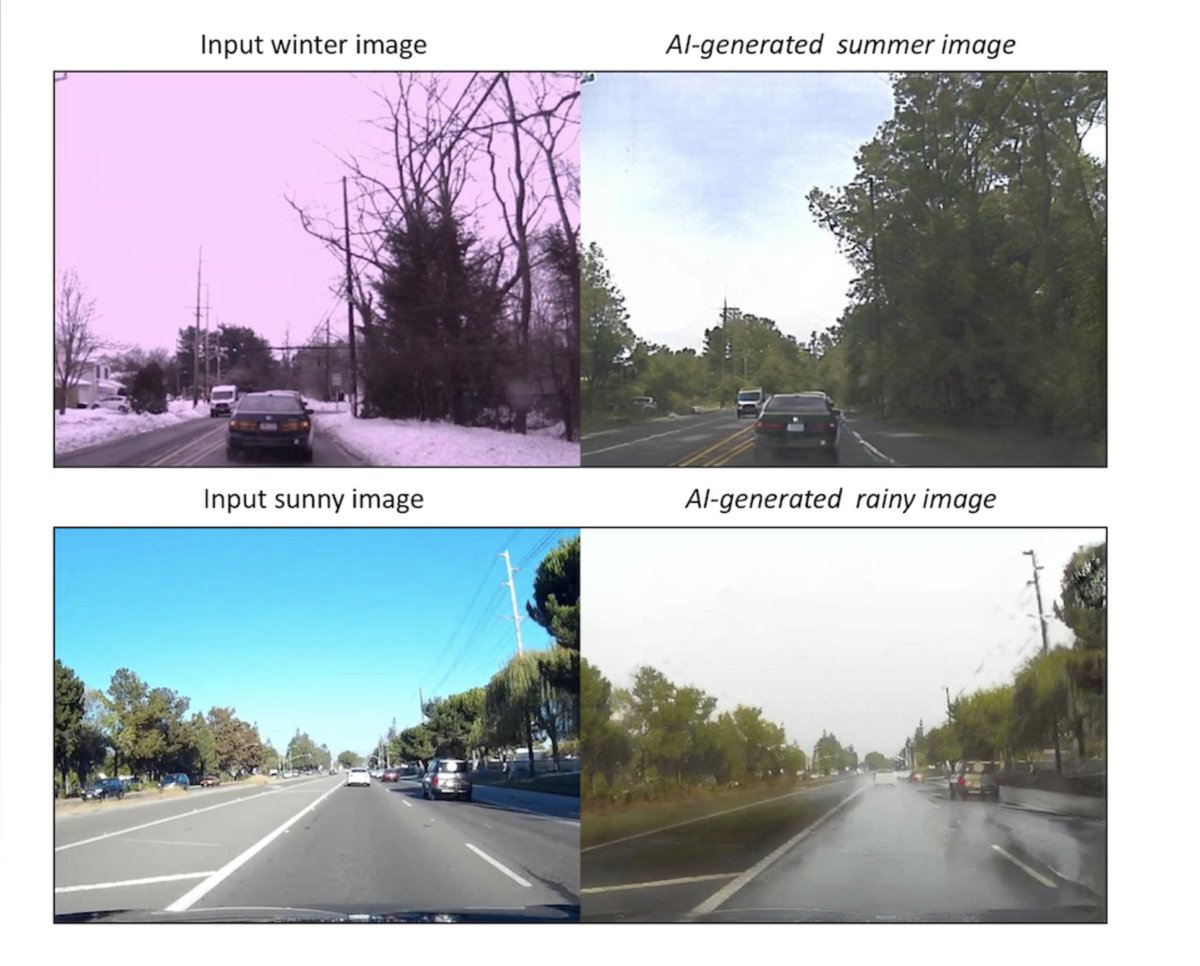
The biggest casualty to AI ....

The biggest casualty to AI won't be jobs, but the final and complete eradication of trust in anything you see or hear. 


Unsupervised image-to-image translation aims at learning a joint distribution of images in different domains by using images from the marginal distributions in individual domains. Since there exists an infinite set of joint distributions that can arrive the given marginal distributions, one could infer nothing about the joint distribution from the marginal distributions without additional assumptions. To address the problem, .... read more at http://research.nvidia.com/publication/2017-12_Unsupervised-Image-to-Image-Translation

Confessions Of A Covered Call Junkie

I've been trading covered calls for about three years, during which time I've made over three hundred trades. I've had my ups and downs and, as is true with any pursuit, my mistakes have yielded my most valuable learning experiences. The purpose of this article is to share some of my key learnings with other investors who are contemplating taking the covered call plunge.

The article is divided into two sections:

  • "Q&A" section that addresses aspects of covered calls which, based on comments I've read in previous SA articles, I believe are often misunderstood; and
  • "Tactics" section that describes the key tactics I employ in my covered call trading.


Covered Call Q&As
What are the risks associated with covered calls?

Risk #1: Lost upside.
Risk #2: See risk #1.
The singular risk associated with covered calls is the loss of upside, i.e. if the shares are assigned (called away), the option seller forgoes any share price appreciation above the option strike price. This represents money left painfully on the table. My approach to this is: Set a yield target at the time you enter into the covered call; if the shares are called away, congratulate yourself that you hit your yield target, and start looking for the next opportunity to make more money. Don't look back, other than to learn from a mistake.

(You may be able to delay or avoid assignment by "rolling" your position, which I'll cover later in the article.)

Read more at https://seekingalpha.com/article/290882-confessions-of-a-covered-call-junkie?page=1

March 30, 2018

Why American businesses and common man love Donald Trump while the mainstream media hates him

HINT - Donald Trump is a businessman and is running the US like a business and not as a politician or bureaucrat.More
Washington spent trillions building up foreign countries while allowing OUR OWN infrastructure to fall into a state of total disrepair. No more! It's time to REBUILD, and we will do it with American WORKERS, American GRIT, and American PRIDE!

My nuclear button is bigger than yours and it works

Hatsoff to US President Donald Trump for bringing N Korea closer to denuclearization. 

See the sequence of events... students of psychology will see excellent persuasion skills at play.

North Korea threatens 'unimaginable' strike on United States

https://www.usatoday.com/story/news/world/.../north-korea-threatens.../779097001/
Oct 19, 2017 - According to a new NBC News/SurveyMonkey poll published Thursday, a majority ofAmericans (54%) — Republicans and Democrats — view North Korea as the most immediate threat to the country. That represents a shift since July, when 41% of Americans viewed North Korea as the greatest immediate ...

Trump threatens to 'destroy North Korea' if necessary | USA News | Al ...

https://www.aljazeera.com/.../trump-threatens-destroy-north-korea-170919140528723...

Sep 19, 2017 - US president expresses hope military action will not be necessary to thwart risk of North Korean nuclear attack. ... gathered in New York, Trump on Tuesday warned that the US would be forced to confront North Korean leader Kim Jong-un if he continued Pyongyang's reckless pursuit of nuclear weapons".

March 29, 2018

Nifty is Still Bullish for Medium and Long Term – Fresh EW Analysis on All Time Frames

Nifty declined more than 1200 points from high and the chart are giving some clarity at higher time frames now. So, today I am revising wave counts on all time frames to identifying the changes and to conclude the further possible road map of Nifty in Long, Medium and Short Term.

Friday, the Ending Diagonal Triangle pattern I was expecting in my earlier analysis report was negated and 10400 Call of April Expiry we bought some days back in 100-80 range was suggested to exit with loss of 40-60 points in 40-45 range because of pattern negation. So, my earlier analysis report Nifty can Bounce by 300-400 Points from 10141-10083 Range is not valid any more.

So, let’s have a fresh look at all time frames again to conclude further possibilities. Read my last analysis report on all time frames at Elliott Wave Analysis Update of Nifty on All Time Frames as on 22 Jan 2018

Read more at http://sweeglu.com/nifty-is-still-bullish-for-medium-and-long-term-fresh-ew-analysis-on-all-time-frames/

NIFTY monthly charts

- bar reversal last month
- monthly close below 10000 can lead to more downside
- support 9000

NIFTY weekly charts

- trend is down
- support 10000-9600 resistance 10700

BANKNIFTY monthly charts

- complete bar reversal happened last month
- this month was a small bar though close in negative
- trend remains down


BANKNIFTY weekly charts

- trend is down
- support 23800-20600 resistance 26000

March 28, 2018

Market outlook

Daily charts
- trend is down on daily charts
- today NF closed 0.6% in negative at 10121
- AD was 1:2
- option writing support 10000 resistance 10500

- note this was a short week (month is also over)
- will post weekly and monthly charts tomorrow

Does a waterfall decline lie ahead?

- the first box shows the buy-on-dips crowd now trained to buy into a falling market
- second box shows the "waterfall" decline"... this is almost a 50% correction... capitulation?
- third box shows long term investors buying coz they saw value.

- is this about to happen all over again? If yes, then keep your cash ready to buy the sale.

Difference between Aadhaar and Social Security Number (US)

Aadhaar is an identification number. Social Security Number is not.

The Social Security Administration website states in a 2009 bulletin: “The card was never intended to serve as a personal identification document – that is, it does not establish that the person presenting the card is actually the person whose name and SSN appear on the card.”

By contrast, Aadhaar has been designed as a single, universal, digital identity number that any registered entity, whether public or private, can use to “authenticate” an Indian resident. Anyone who has lived in India for 182 days can enroll in Aadhaar for proof of identity, while only citizens and those authorised to work in the US can obtain a Social Security Number.

Aadhaar authenticates a person. The Social Security Number does not.

March 27, 2018

Hot stocks and charts

LAST updated: 27-MAR-2018 
BHARATFIN
BHARATFIN chart

Market outlook

Daily charts
- trend is down on daily charts
- today NF closed 0.5% in positive at 10184
- AD was 3:1
- support 10000 resistance 10500

Are human beings good at judging people? #ScottAdamsSays

We all like to think of ourselves as clever while unable to hold similar views of other people.

Sample these comments by a journalist in the NY Times:

Add to his sense of panic his compounding emotional and psychological liabilities: He has an inflated view of his own skills, talents and expertise. He knows only a fraction of what he has convinced himself that he knows.
He prefers casual conversation to literary examination, opting to listen rather than to read, which is both a sign of a severely compromised and restrained intellect and an astounding arrogance about one’s information absorption.

The person being referenced here is none other than the US President Donald Trump.

How the hell can anyone arrive at these conclusions about someone else is something which beats me. This is a classic case of hallucinating or having a bias against someone and then creating content to support those views.

I am not perfect, you are not perfect (we all have our flaws and biases) and out of these imperfections we see the others and the world. Given this, it is difficult for anyone to form a correct view (there is nothing called a correct view actually).

But we still form our own opinions which we hold to be correct while being dismissive about other people who also form their own opinions.

Read complete article at https://www.nytimes.com/2018/03/25/opinion/donald-trump-war.html

Market outlook

Daily charts
- trend is down on daily charts
- today NF closed 1.3% in positive at 10131
- AD was slightly negative
- option writing support 10000 resistance 10500
- swing high is 10500

March 24, 2018

My daughter just did her first trade... or investment

Today I did my first trade in the stock markets.

My father opened my trading account when I turned 18. The trading account was opened with Upstox; a low cost brokerage. Due to market conditions we did not invest earlier and in hindsight, it was a good decision. But now that the markets (NIFTY) have dropped from 11,000 to 10,000, my father thought it appropriate to invest in the stock market. After a lot of study we came to the conclusion that the best instrument to invest would be an exchange traded fund; in our case it was NIFTYBEES.

What I learned today was:
  • Customizing my Upstox trading account.
  • Adding funds via logging in from my bank account.
  • Placing a buy order. (I attempted twice but the buy order failed. The third time it went through properly.)
Note that I'm investing in an ETF (Exchange Traded Fund) and not in a particular stock but if the market does well, I will benefit. 

My holding period will be in the region of a few years at the very least. And my targeted rate of return in 18% - 20% CAGR. 

Read more about her blogging at http://www.shamika.in

NIFTY weekly charts

- trend is down
- next supports 9600-9000

BANK NIFTY weekly charts

- trend is down on weekly charts
- next support 20600

March 23, 2018

Market outlook

Daily charts
- trend is down on daily charts
- today, NF opened gap down but closed flat at 9998
- AD was 1:5
- option writing support 10000 resistance 10500
- difficult interpreting high OI at 10000 put
- does this mean a bottom is in place? I don't know

Has the market bottomed out?

For the 3rd time in March, I feel the market has bottomed out; Can we make it final, today? 😀 Many investible quality stocks are priced very attractively today. Ignore a dozen negatives that you hear - trade tariff, politics, bank frauds, LTCG, rate hike etc.

How trailing SL helped in this correction

Markets started correcting from FEB this year. But just because NIFTY gives a sell signal does not mean you sell the stocks. So I keep a trailing SL for all stocks and this gets continuously shifted up.

The last open position was in ASHOKLEY .. incidentally the stock made a lifetime high just few days ago even as NIFTY made a low for the year.

Open positions as of 12-JAN

Market outlook

Daily charts
- trend is down on daily charts
- today NF closed 0.4% in negative at 10115
- AD was1:4
- option writing support 10000 resistance 10500

March 21, 2018

Market outlook

Daily charts
- trend is down on daily charts
- today NF closed 0.3% positive at 10155
- AD was flat
- VIX dropped 3%
- option writing support 10000 resistance 10500

Nifty can Bounce by 300-400 Points from 10141-10083 Range

Nifty opened lower at 10345, decline sharply just after opening and traded with huge negativity for rest of the day. Nifty declined by about 180 points to register day’s low 10180 and closed 165 points down at 10195.

Yesterday, I expected an Ending Diagonal Triangle in progress and a decline below 10141 was expected without breaking above 10631 to complete this pattern. 10420 was immediate breakeven point and stoploss for shorts.

Short term trading strategy was Selling on Rise with stoploss of 10421. And I also suggested holding hedge trade taken on Monday/Tuesday by buying 10600 Call and 10300 Put in equal quantity till further update. Hedge trade was giving 60-70 points profit on Friday. Let’s have a fresh look at latest charts for further scenario.

Read more at http://sweeglu.com/nifty-can-bounce-by-300-400-points-from-10141-10083-range/

March 20, 2018

NIFTY hourly charts

- trend is down
- bullish on breakout above 10200 F


Same chart with kplswing indicator

BANK NIFTY hourly charts

- trend is down
- bullish on breakout above 24420 F

Market outlook

Daily charts
- trend is down on daily charts
- today NF closed 0.3% in positive at 10124
- AD was negative
- option writing support 10000 resistance 10500

March 19, 2018

12 Trading Mantras from Trading Legend Mark Douglas

Fill the “profit gap” with the right things…
In his books and seminars, Mark Douglas often refers to something he calls the “profit gap”. What he is talking about is basically the difference or “gap” between the potential profit you could achieve if you had just followed your trading method and what your actual bottom line results are.
Traders often begin trading a method with very high hopes. They want to produce an income they can rely on and get consistent results from their trading. However, this is only possible if you are trading an effective method with discipline and consistency, which most people simply do not do and as a result, they experience the profit gap that Mark refers to.
The key point that Mr. Douglas makes about this profit gap is that traders typically try to fill the gap by learning more about the market, changing methods, spending more time in front of their computers etc. However, what they really need to learn is more about themselves and how they interact with the market. Essentially, they need to acquire the “proper mental skills” to trade their method as they should and to get the most out of it, in order to properly fill the profit gap.

Winning and being a winning trader are two different things…

Anyone, and I literally mean anyone, even a 5-year-old child, can find themselves in a winning trade. It does not require any special skill to get lucky on any particular trade and hit a winner. All you have to do is open your trading platform and push a few buttons and if you get lucky, you can make a lot of money in a short amount of time.
As a result of the above, it’s natural for a trader who has not yet developed his or her trading skills to take the leap from “it’s easy to win” to “it can’t be that much harder to make a living from this”.
This is how many traders’ careers get started. Needless to say, it is also how they get on the path to losing a whole lot of money just as fast or even faster than they made it.
A winning trader has the mental skills to realize, understand and utilize the FACT that any particular trade he or she takes has basically a random outcome. That is to say, they cannot possibly know the outcome of that trade until it is over. The winning trader knows this and they also know that they must trade in-line with this belief over a large series of trades and ignore all the temptations and feelings that get kicked up on each trade they take. They are able to do this because they keep their eyes on the bigger picture. That bigger picture is the fact that IF they execute their method flawlessly, over and over, over a long enough period of time / series of trades, they will come out profitable.
Thus, do not mistake a winning trade for you being a winning trader, yet. A very easy trap to fall into.

Mental skills are the key to trading

A key point that Mark Douglas really seems to want to drive into people is: Even if your method is a high-probability method, it’s the proper execution of that method that you need proper mental skills for. If you don’t have those mental skills, even a winning strategy will lose.
Mental skills are things like; staying focused on the process, on your method, and not worrying about the consequences if this trade goes wrong. If you don’t have the proper mental skills to stay positively focused on the process of trading; on doing exactly what you need to do when you need to do it without reservation, hesitation or fear, you will not make money in the market.
It’s critical to remember that no matter how good your technical method is at generating wining trades, turning those winners into a consistent income takes the ability to do or not do some things that the method can’t help us with. The method can’t force us to pre-define our risk, or with making the mistake of moving our stop closer and stopping us out prematurely, it can’t stop us from hesitating and getting in too late or from over-trading or from getting out too soon and leaving money on the table. No matter how good the method, if you make mental errors you will lose.
If you really boil down what Mark is saying by his comments on “mental skills”, it basically comes down to having ice-cold ‘blood in your veins’ discipline. Mental skills like discipline essentially means the ability to control yourself and especially your behavior / actions in the market against the CONSTANT TEMPTATION the market gives us. Essentially, as a trader, you are fighting against yourself to see which part of your brain has more control; the older, emotional and more primitive part or the more advanced logic and planning parts.

Trading rangebound stocks

Sometimes a stock tends to trade in a range for extended periods of time. This can happen in any timeframe... intraday, daily, weekly and so on.

Whatever trading system you are using, there will be a whipsaw in a particular timeframe. This will not be apparent immediately but 2 consecutive loss making trades should alert you to the event.

See this chart of ULTRACEMCO where the first two whipsaws (highlighted region) point to a rangebound market. At this point, you should ignore all signals till the stock breaks out from the range.

Note that while the stock is rangebound in one timeframe, you can make good money by trading in the next lower degree timeframe.


Market outlook

Daily charts
- trend is down on daily charts
- today NF closed 1% in negative at 10094
- AD was 1:6
- note that the region of 10000 to 10100 is strong support area
- option writing support 10000 resistance 10500
- next support 9500

March 17, 2018

NIFTY weekly charts

- trend is up
- support 10000
- next support 9600

March 16, 2018

AFL to display All Time High / Low for stocks (Amibroker only)

This AFL displays list of stocks at their All Time High and Low.


>>> AFL starts
//copyright kpl@vfmdirect.com
//This AFL displays all time high and low for stocks

Filter=(H==Highest(H) OR L==Lowest(L)) AND C>20;

AddColumn(C,"Close",1.2);
AddColumn(Highest(H),"All time Hi",1.2,colorDefault,IIf(H==Highest(H),colorLightBlue,colorDefault));

AddColumn(Highest(L),"All time Lo",1.2,colorDefault,IIf(L==Lowest(L),colorOrange,colorDefault));

<<< AFL ends 


Market outlook

Daily charts
- trend is down on daily charts
- today NF closed 1.6% in negative at 10195
- AD was negative at 1:2
- option writing support 10000 resistance 10500
- region of 10000-10100 likely to offer support

Outlook and Trading Strategy of Nifty for 16 Mar 2018 Onward

Nifty opened almost flat at 10405 and bounced further to register day’s high 10420 but failed to sustain at higher levels and decline by more than 70 points to register day’s low 10346 and finally closed 50 points down at 10360.

Yesterday, I expected an Ending Diagonal Triangle in progress and 10440 was the point from where we can get clue of next move, but a decline below 10141 or bounce above 10631 was expected soon. 10389 was immediate breakeven point below which further decline towards 10336-10223 was expected.

Short term trading strategy was Selling on Rise with stoploss whenever getting opportunity. And I suggested holding hedge trade taken on Monday/Tuesday by buying 10600 Call and 10300 Put in equal quantity till further update. Let’s have a fresh look at latest charts for further scenario.

This analysis report is covering bounce from low 6825 and earlier wave counts are explained in my last “All time Frame” report Elliott Wave Analysis Update of Nifty on All Time Frames as on 22 Jan 2018

Read more at http://sweeglu.com/outlook-and-trading-strategy-of-nifty-for-16-mar-2018-onward/

March 15, 2018

Market outlook

Daily charts
- trend is down on daily charts
- today NF closed 0.5% down at 10360
- AD was 2:1 (bullish sign)
- option writing resistance 10500

You Don’t Know What You Want

The problem is that the human brain is a “meaning machine,” and it will make sense out of literally anything put it front of it.

Earlier today I watched psychologist Petter Johansson TED talk on “choice blindness”— a phenomenon where we convince ourselves something is what we want, even when it isn’t.

Johansson poses the question, “do you really know why you do what you do?” And even as we all will swear up and down “yes” in response, he proves we rarely do.

He describes two experiments he ran in which participants were asked to rate their preferences between two things, and then asked to explain why.

Seems simple enough.

Except that as part of the experiment, he reversed their preference, presenting the opposite selection back as though they’d chosen it, without telling them. And the crazy thing was: when asked, they’d still “explain” why it was their preference.

In other words: we have no idea what we want. We are inherently fickle and easily swayed.

So when it comes to “looking inside ourselves” for an answer, the reality is: that answer will never be there.

“A lot of what we call self-knowledge is actually self-interpretation. So I see myself make a choice, and then when I’m asked why, I just try to make as much sense of it as possible when I make an explanation. But we do this so quickly and with such ease that we think we actually know the answer.”

And the reverse side of this coin? Confirmation bias, of course: once we make a selection, we’ll do most anything to rationalize it. Which is why action will always trump analysis, even — especially — when it comes to “figuring out what we want.”

Read more at https://medium.com/@krisgage/you-have-no-idea-what-you-want-757567375d31

March 14, 2018

Market outlook

Daily charts
- trend is down on daily charts
- today NF closed flat at 10410
- nifty formed lower high lower low (first day, 2-3 are allowed in a rally)
- AD was flat
- option writing range 10000-10500

RIP Stephen Hawking - a brilliant person from whom I learned a lot about the universe

“Remember to look up at the stars & not down at your feet.Try to make sense of what you see & wonder about what makes the universe exist. However difficult life may seem there is always something you can do & succeed at. It matters that you don’t just give up.”


Stephen Hawking died Wednesday after complications due to amyotrophic lateral sclerosis, a progressive neurodegenerative disease. He was 76.

The world-renowned theoretical physicist and cosmologist was best known for his work on black holes. Hawking theorized that, contrary to the prevailing scientific belief that black holes were inescapable for all forms of matter and energy, they actually emitted a form of radiation ― now known as Hawking radiation. He also played a key role in the mathematical effort to unify Einstein’s general theory of relativity with the emergent field of quantum physics.

March 13, 2018

Market outlook

Daily charts
- trend is down on daily charts
- NIFTY closes flat at 10427
- formation of higher high higher lows is intact
- AD was positive at 2:1
- option writing support 10000 resistance 10500

Circular reasoning?

Wouldn’t the people who are better than me be smart enough to avoid spending time with me?

"It's better to hang out with people better than you. Pick out associates whose behavior is better than yours and you'll drift in that direction."

Notes from a hybrid trader

One developing trader at our firm is not viewing his trading future only as a discretionary trader, but as a hybrid trader.  A hybrid trader uses technology to make better trade decisions, and pulls money out of the market as a discretionary trader, discretionary trader armed with tools to make better trade decisions, and with automated models.
Here is that trader’s review after a recent trading session (edited):

March 12, 2018

Jumping in a trade early before a signal or breakout

KPLTweet text