June 30, 2017

Mitron: definition/ meaning

1. A large group of unsuspecting people, about to be hit by something they will take a long time to recover from.

2. A precursor to bad news for large groups of people.

Origin

India: from the Hindi word Mitron, ironically meaning 'friends'. In recent times, however, it has been used to brutal effect to make a series of anti-people announcements.

Most recent example/ event: Demonetisation

GST cartoon: humour

Option writing support JULY series


Let's see what happens this series.

NIFTY weekly charts

- trend is up on weekly charts
- this week, NF closed 0.6% in negative
- good support at 9300

BANK NIFTY weekly charts

- trend is up on weekly charts
- this week, BNF closed 1.4% in negative
- support 22400

Introduction of Futures & Options Contracts on 5 additional securities

Market outlook

Daily charts
- trend is up on daily charts
- today, NF opened gap down below yesterday's low
- there was buying at lower levels and NF closed marginally in positive
- lower trendline is offering support
- AD was flat
- swing low support 9300

June 29, 2017

Market outlook

Daily charts
- trend is up on daily charts
- today NF closed flat amidst large swings.
- AD was 2:1 while VIX dropped 5%
- above are bullish indicators.
- swing low support 9300
- option writing support 9400
- tomorrow, holding 9470 spot or above today's highs (9575 spot) will be bullish.

June 28, 2017

NIFTY option open interest levels

Option writers bullish that 9400 will hold in JULY.... this means more upsides until they start writing calls.

NIFTY triangle size 200 points... so where is it headed?

Market outlook

Daily charts
- trend is up on daily charts
- today, NF closed flat.
- AD was flat
- swing low support 9300

Warren Buffet: intelligent people do not need leverage

There is no reason for an intelligent person to use leverage as he will get rich anyways, and if you are not intelligent, god forbid, leverage is the last thing you need.

How F&O stocks are manipulated

June 27, 2017

Market outlook

Daily charts
- trend is up on daily charts
- today, NF broke a recent/ minor support
- NF closed 0.7% in negative
- AD was 1:4 while VIX was up 8%
- swing low support remains at 9300

Neowave outlook on markets

....Sensex itself showed “Inverted Hammer” like candle on its Weekly chart. A decisive weakness & close below its bottom would be considered as -ve follow-up to the bearish pattern.

All in all, it looks like “g” leg has been a substandard up-move as compared to previous up-moves of “a”, “c” and “e” legs. Price-wise, “g” so far measures only about 500 Sensex pts against 1000 Sensex pts achieved by the previous up-moves.

....

The internal lower-degree development inside “g” can be checked on Intra-day chart, as per which, the fall of Thursday-Friday can be marked as the possible lower-degree d-leg of such Extracting Triangle.

Read more at http://content.icicidirect.com/ULFiles/UploadFile_2017627105150.asp

June 26, 2017

Risk management: Art of Living for another day ... by Manish Dhawan

So… What is Risk management ?

Cutting to the chase, in very simple terms, I define Risk Management as a plan to ensure that I live to see another day. That is it. That is all there is to it. If the worse that can happen, does not kill you, rest of it would be only the upside.
What is an Uncle Point?

Warren Buffet: you cannot help but get rich if you are patient

Excellent interview with Mohnish Pabrai ... must see for all investors and people losing money big time in futures/ options.

June 24, 2017

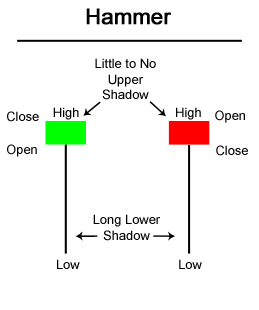
About Hammers and Inverted Hammers

This is a Hammer.. this can be bullish or bearish depending on where it happens. After a strong uptrend, this has bearish implications and vice versa.

Understanding the psychology of market participants will explain everything.

Related image

And this is an Inverted Hammer... sometimes known as shooting star (suggesting bearishness).

BANKNIFTY weekly charts

- trend is up on weekly charts
- support 22400

NIFTY weekly charts

- trend is up on weekly charts
- last 3 weeks NF is rangebound
- NF trading within range of last bull bar
- support 9300

June 23, 2017

My crazy wild trades today

Ideally MTM on close should have been 40K but made some bad exits.

NIFTY hourly charts

- note faster move in opposite direction
- good support 9580 F
- below this, expect deeper correction.

Market outlook

Daily charts
- trend is up on daily charts
- today, NF closed 0.6% in negative and below 9600
- AD was negative
- swing low support 9300
- immediate support 9500 (hourly charts)

Lots of sell signals today

Most stocks are being sold off from quite some time though...

June 22, 2017

Market outlook

Daily charts
- trend is up on daily charts
- today, NF closed flat
- AD was negative (3:5)
- note there was strong selling intraday
- swing low support 9300

GST explained in one picture

GST is not simply one nation one tax.

It is 4 tax slabs, 3 types of GST, 3 returns per month and 37 returns per year.

June 21, 2017

Market outlook

Daily charts
- trend is up on daily charts
- today, NF closed 0.2% in negative
- AD was flat
- swing low support at 9300

June 20, 2017

Swing trading signals :: 20-JUN-2017

Swing trading signals :: 20-JUN-2017

  • This report is for educational purposes only and is not recommended for trading or investment.
  • Liquidity filter: ||||| excellent liquidity - ||||| good liquidity - ||||| low liquidity.


Stock nameClosePercentage ChangeSignalReversal
Level/ SL
Last Month's
1 day20 daysHighLow
||||| ALPHAGEO879.55-3.00%-6.00%SELL1085.001085911
||||| BALKRISIND1627.851.00%9.50%BUY1440.0016061425
||||| BEML1501.454.00%25.50%BUY1125.1514091125
||||| BEPL56.356.00%44.00%BUY38.104535
||||| CANFINHOME3199.702.00%23.50%BUY2527.0529002445
||||| CHOLAFIN1131.603.50%10.50%BUY985.251135985
||||| CORPBANK55.754.00%9.50%BUY48.706549
||||| DAAWAT67.20-2.50%-14.00%SELL82.258564
||||| FAGBEARING4780.201.50%7.00%BUY4415.0049374400
||||| GABRIEL156.003.00%23.50%BUY122.80135122
||||| GINNIFILA61.608.50%58.50%BUY36.254836
||||| GODREJCP1937.202.50%9.50%BUY1733.3519581727
||||| HINDZINC253.202.50%5.50%BUY226.85272227
||||| IBREALEST208.904.00%25.50%BUY151.10180148
||||| IBVENTURES177.656.50%26.50%BUY130.10158102
||||| ICICIBANK292.45-8.50%-4.00%SELL327.40327271
||||| IDBI55.90-2.00%-13.50%SELL63.958359
||||| IMFA468.104.00%10.50%BUY385.00590402
||||| INDIGO1232.302.50%17.50%BUY1041.7011521004
||||| JHS75.703.00%62.00%BUY49.005744
||||| JKPAPER96.60-2.50%-10.00%SELL110.80122102
||||| KWALITY156.851.00%11.00%BUY133.00156133
||||| NFL77.70-1.50%-5.00%SELL85.708978
||||| NIITLTD92.805.50%9.00%BUY84.159478
||||| NLCINDIA109.953.00%8.50%BUY95.0011295
||||| PGEL268.455.00%52.50%BUY171.15208171
||||| PRABHAT127.803.50%10.50%BUY93.4012793
||||| PUNJLLOYD17.80-3.00%-16.00%SELL23.452520
||||| RAMCOIND256.707.00%12.50%BUY221.55258212
||||| SNOWMAN59.5510.00%6.50%BUY53.756354
||||| SREINFRA116.805.50%14.00%BUY97.1011691
||||| TATAINVEST768.907.00%17.50%BUY634.45701634
||||| TATASTEEL522.350.50%6.50%BUY476.70521428
||||| THOMASCOOK233.602.50%11.00%BUY204.10229203
||||| TVSELECT195.658.50%11.00%BUY168.25208168
||||| VASCONEQ38.70-4.00%-24.00%SELL57.605944
||||| VSTTILLERS2280.1511.50%17.50%BUY1876.3020401876

Market outlook

Daily charts
- trend is up on daily charts
- today, NF closed flat at 9653.
- AD was negative
- swing low support at 9300

June 19, 2017

Neowave outlook of market

...
The question for the fresh week, therefore, is whether “f” is now completed, and whether an upward “g” leg would open from here.

As an initial sign than “f” is over and upward “g” is opening, Index needs to strengthen & close above its previous day’s high.

...

The question is also whether “f” would be completely retraced upwards in “faster” time. Previously, 8-day “b” leg was fully retraced in a day. Similarly, 5-day long “d” leg was also fully retraced in a day.

We cannot, therefore, rule out that if an upward “g” leg opens, it can retrace the 8-day long “f” leg within a day or 2, which could make shorts to run for cover like the last 2 times.

...

On Sensex, the 5-day lows are similar, 31044-62-55-26-17, from Monday to Friday of the Week. All these values are also close to the Grey channel. So, a Bull candle holding around 31K, can be an initial +ve sign.

This, followed by strength/close above Fri’s high (31183/9616), could mean that the downward “f” leg may be over, and upward “g” leg is opening. As already warned, “g” can be a strong up-move.

Read more at http://content.icicidirect.com/ULFiles/UploadFile_2017619104326.asp

Market outlook

Daily charts
- trend is up on daily charts
- today, NF closed 0.7% in positive
- but AD was negative
- swing low support at 9300
- note, we may have a trend line breakout

June 18, 2017

June 16, 2017

NIFTY open interest analysis

After a long time, I am seeing highest OI in a call... limited upsides?

Market outlook

Daily charts
- trend is up on daily charts
- today, NF closed flat/ small trading range
- AD was flat
- yesterday's low provided some support
- note smaller pace of correction (more upsides possible?)

June 15, 2017

Market outlook

Daily charts
- trend is up on daily charts
- today, NF closed 0.4% in negative
- AD was flat 
- swing low support 9300

June 14, 2017

Finally, an Amibroker AFL bridge for Upstox

Hi XXX,

We are happy to announce the launch of AmiBroker AFL Bridge for Upstox. Starting today, you can link AmiBroker strategies to Upstox Pro Web. Using the Upstox Bridge to AmiBroker AFL you can finally fire orders from AmiBroker to Upstox Pro Web. 

The best way to learn about the Upstox Bridge to AmiBroker AFL is to attend the upcoming webinar. 

You can learn everything you need to know about installing the new product from our LIVE webinar. 

Time: 1 p.m. 

Date: June 15, 2017


Also, check out this blog by Upstox co-founder Shrini Viswanath about the Upstox Bridge to AmiBroker.

Looking forward to seeing you at the webinar! 

Cheers,
Upstox

Correlation between skirt length and stock markets

Short summary - correlation does not imply causation. But this is very difficult for the common man to accept as it goes against his very grain of thinking.

So I came up with this topic of how skirt lengths influence the stock market and vice versa.

This is what Google search threw up... you can think of any number of silly variables and try and correlate this with stock market movement.

Skirt Length Theory - Investopedia

www.investopedia.com/terms/s/skirtlengththeory.asp
The idea that skirt lengths are a predictor of the stock market direction. According to the theory, if skirts are short, it means the markets are going up. And if skirt ...

Video: Predicting the Stock Market With Skirts and Ties | Money

time.com/money/3845782/skirt-length-indicator-stock-market/
May 11, 2015 - Nobel Prize-winning economist Robert Shiller of Yale talks about skirt lengths as a predictor of stock market prices.

What Skirt Lengths Tell You About The Stock Market - Money Morning

https://moneymorning.com/2012/08/.../what-skirt-lengths-tell-you-about-stock-marke...
Aug 20, 2012 - Turns out the length of a hemline, in pretty reliable is a stock market ... the linkbetween women's hem lengths and stock market conditions was ...

The Long and Short of It: The Skirt Length Theory - Ali Basye

alibasye.blogspot.com/2007/09/short-skirts-and-stocks-from-history.html
Sep 2, 2007 - ... used as a barometer to determine the outlook of the stock market. Though market analysts didn't pick up on the connection at the time, the Skirt Length Theory, an indicator of market value and consumer behavior, was born.


Karnataka under pressure to waive Rs 50,000 crore agricultural loans

NIFTY Options Open Interest


- highest open interest at 9500 PE (writers are bullish)
- big addition in 9600 PE
- reduction in 9700 and 9800 CE (some more upsides?).

Market outlook

Daily charts
- trend is up on daily charts
- today, NF closed marginally in positive
- AD was negative
- swing low support 9300

June 13, 2017

Market outlook

Daily charts
- trend is up on daily charts
- today NF closed marginally in positive / above 9600
- AD was flat
- swing low support at 9300

Loan waiver: first UP, now Maharashtra. Next MP? Gujarat? Punjab?

What about the honest farmer who has diligently repaid his loans?

He looks like a fool now.

Put differently, there is no longer any incentive to repay loans.

And this is bad news for banks and micro finance companies.

June 12, 2017

Market outlook

Daily charts
- trend is up on daily charts
- today, NF closed 0.5% in negative
- AD was 1:2 while VIX increased by 5%
- swing low support 9300

Neowave outlook of markets

...So, if now the upward leg “e” leg is over, the question is whether the downward “f” leg would also consume a total period of 5-8 days and drop closer to the top of “c” leg.

In other words, we may watch if the downward “f” leg consumes 2-5 days more from here, time-wise, and if it drops closer to 30712 (Nifty 9533) which was the top of “c” leg, price-wise.

...

Friday’s action itself looked significant because it initially broke the 5-day lows of 31172-98 (Nifty 9630-40), but as Bulls came in at lower levels, it avoided any decisive close below the 5-day lows.

As a result, Friday’s action formed into a Thrusting Line Bull candle, which can open sideways to +ve options on further follow-up strength & close above its Head at 31290 (Nifty 9676). That could prove challenging, as the initial cues appear -ve as we begin trading a fresh week.

Read more at http://content.icicidirect.com/ULFiles/UploadFile_2017612101754.asp

Nifty can be Bought in 9608-9568 Range for New High Above 9709

Nifty opened mild lower at 9638 and declined further to register day’s low 9608 but bounced again from lower levels to register day’s high 9676 before closing 21 points up at 9668.

Friday, a corrective decline towards 9622-9658 was expected and trading strategy was to hold Nifty shorts taken in 9679-9709 using fresh stoploss of 9689 expecting same target 9622-9568. Nifty declined further to achieve minimum target 9622, registered low 9608 but bounced again towards 9676. Let’s have a fresh look at latest charts for further scenario.

Read more at http://sweeglu.com/nifty-can-be-bought-in-9608-9568-range-for-new-high-above-9709/

June 11, 2017

NSE advance decline chart

- no improvement in market internals as yet

Nifty can be Sold in 9679-9709 Range with Stoploss of 9710

Note: this article was posted on 7-JUN.

Nifty opened higher at 9704 and registered new all time high 9709 but failed to sustain at higher levels and decline back sharply to register day’s low 9630 before closing 37 points down at 9637.

Friday, Nifty was expected to bounce towards 9706-9779 at least in near term and 9649 was short term reversal or breakeven point. And suggested to hold Nifty longs taken in 9590-9581 range on last Thursday expecting minimum extended targets 9706-9779. Nifty achieved minimum target 9706 and then decline back. Let’s have a fresh look at latest charts for further scenario.

Read more at http://sweeglu.com/nifty-can-be-sold-in-9679-9709-range-with-stoploss-of-9710/

NIFTY weekly technicals

- trend is up
- support 9300

BANK NIFTY weekly technicals

- trend is up
- support 22400

June 9, 2017

Market outlook

Daily charts
- trend is up on daily charts
- today, NF closed 0.2% in negative
- AD was flat
- swing low support 9300
- option writing support 9500

How Blackstone’s CEO Made It Through Wall Street’s Most Turbulent Decade

Steve Schwarzman is the founder and CEO of Blackstone Group, the largest alternative investment firm in the world (AUM USD 300 billion).

An excerpt from an interview....

We’ve had a different strategy all along. One part was to be in the advisory business; it required no capital and generated cash, which we could use to hire more people without diluting. Second, to get into the private equity business; it was a great business and still is. And the third was to find other fantastic investment opportunities from a risk-reward perspective. So that was our strategy from Day One. I was sort of in the last generation of people in finance who did everything. It was before specialization. If you were in corporate finance at that time, like I was, you were doing mergers, IPOs, debt deals, debt for equity swaps, restructuring—anything that needed to be done you did. And because you were seeing the entire field in play, you realized that nothing lasted forever. There are no patents in finance. Everything has a decay curve, in terms of its margins. You had to be in the continual invention business to do well. I just took it for granted that we had to keep inventing new things all the time.

.....

When we went into the crisis, we already had the platforms. As the opportunities presented themselves, all of our businesses were in great shape. We didn’t have to deal with the world of problems. We were good underwriters, and the opportunities were profound—they were almost everywhere. And so that enabled us to enter those different business lines further. We basically raised very, very large-scale capital from everyone we could. The more successful the outcome, the more they wanted to give us. And it became a virtuous circle of doing well for them, looking for new opportunities whenever we could, and them giving us very large amounts of capital. Our timing was right for all of these different opportunities. The system we designed, of being able to see across asset classes and controlling risk, informed us where we should be and not be, which enabled us to grow very large-scale businesses with a small number of people. I think for people who weren’t set up like that, it was much more difficult.

.....

Read more at https://www.bloomberg.com/features/2017-blackstone-steve-schwarzman-interview

About missing a stock rally because of fundamentals

>>>

I must admit that our call on TVS has gone wrong consistently, because from Rs 270 onwards, we kept a sell rating on TVS,” said Daljeet Singh Kohli of IndiaNiveshBSE -0.12 %.

The stock was trading at Rs 535 on Tuesday.

Kohli said his thesis for the ‘sell’ rating was based on the fact that the stock was trading at twice the multiple of Hero Honda and Bajaj, whereas margin profile was half of theirs. Even return ratios were half of theirs. “Going by valuation theory and on pure fundamentals, it does not make sense to go for a company that is making half the margins to trade at double the valuation of its peer,” Kohli said.

<<<

Question: of what use is your fundamental analysis if you cannot make money?

Read more at: http://economictimes.indiatimes.com/articleshowsp/59013945.cms

There are no brave old people in finance.

So part of what benefited us was that we’re risk-averse.
I have a saying: There are no brave old people in finance.
Because if you’re brave, you mostly get destroyed in your 30s and 40s.
But if you make it to your 50s and 60s and you’re still prospering, you have a very good sense of how to avoid problems and when to be conservative or aggressive with your investments.

June 8, 2017

SILVER technicals

- trend is down on weekly charts
- sustaining above 44000 is bullish
- immediate support 38000

GOLD technicals

- trend is down on weekly charts
- sustaining above 30000 will be bullish
- support 28000

Share this...