October 29, 2016

Hot stocks and charts

LAST updated: 28-OCT-2016 

Simple rules

  • This information is for your study only and is not a recommendation to buy or sell.
  • Consider trend as UP when a stock gives a breakout above last month's high
  • To lock in gains, use a trailing SL (last month's low or last 2-3 weeks low)
  • Expect half the trades to (statistically) fail so manage the risk management in every trade
  • Limit risk per trade to maximum of 1% of your capital
  • In case of narrow ranges, consider the bigger / previous trading range as breakout levels
  • Pay attention to large bar breakout days or one day large reversal bars.
ASHOKLEY
ASHOKLEY chart

This Diwali, say a big NO to crackers and fireworks

Diwali is a festival of lights. 

Celebrate this the traditional way.

Say NO to crackers and fireworks and make the world a better and safer place.

I stopped buying these 10-15 years ago. You too can do so.


Happy Diwali.

October 28, 2016

BANKNIFTY weekly and monthly charts

- trend is up on weekly charts
- holding 18800 is bullish


NIFTY weekly and monthly charts

Weekly charts
- trend is up
- good support formed around 8500
- on line charts, roughish H&S seen

Market outlook

Daily charts
- trend is up on daily charts
- today, markets closed in positive, AD positive
- VIX up 4%... this was unexpected
- holding 8500 will be bullish this series
- breakout level 8800

October 27, 2016

Market outlook

Daily charts
- trend is up on daily charts
- today markets closed flat, AD was negative
- VIX down 3%
- markets still within falling channel
- breakout from channel will be bullish
- option writing support 8500 resistance 9000 NOV series
- OCT series same levels and these were never broken

October 26, 2016

Market outlook

Daily charts
- trend is up on daily charts
- today, markets reversed from upper trendline of falling channel
- markets closed 1% in red, AD was negative
- VIX was negative implying no panic
- option writing support 8500 (NOV series)

Rise of the machines: UBER's driverless truck travels 120 miles in 2 hours

A self-driving truck has made its first commercial delivery run in the US, carrying a vital cargo to a depot in the Rockies: thousands of cases of beer.

The automated semi took to the open road as part of a partnership between the brewers of Budweiser and ride-hailing firm Uber.

It made the 120-mile (190 km) journey from Fort Collins to a depot in Colorado Springs, without a driver behind the wheel - a first for commercial cargo delivery and driverless technology.

The big rig, equipped with an array of camera, radar and LIDAR sensing technology, then proceeded to drive itself along I-25 between Fort Collins and Colorado Springs at an average speed of 55 mph, using GPS and hyper-accurate digital maps created on a scouting run to guide the way.


Also read: Uber Is Betting We’ll See Driverless 18-Wheelers Before Taxis


Ease of doing business: Little change for India

NSE stock signals

LAST updated: 25-OCT-2016 

Simple rules

  • This information is for your study only and is not a recommendation to buy or sell.
  • Consider trend as UP when a stock gives a breakout above last month's high
  • To lock in gains, use a trailing SL (last month's low or last 2-3 weeks low)
  • Expect half the trades to (statistically) fail so manage the risk management in every trade
  • Limit risk per trade to maximum of 1% of your capital
  • In case of narrow ranges, consider the bigger / previous trading range as breakout levels
  • Pay attention to large bar breakout days or one day large reversal bars.
ADANIPORTS
ADANIPORTS chart

October 25, 2016

NIFTY option writing trades - II

This post has my option trades (mostly writing) from 17th OCT onwards

Market outlook

Daily charts
- trend is up on daily charts
- still trading in falling channel
- deep support 8500 (option writing)
- today, markets flat, AD flat.

October 24, 2016

Neowave outlook of market

>>>
After hitting higher high-low from Tuesday to Thursday, Index hit a lower high-low on Friday. On the Intra-day chart, the action at the top of the week was looking like a “possible” Head & Shoulders formation. Coming week could be all about success or failure of the H&S possibility.

The success of the H&S pattern would require high-volume break below its “Neckline”.

Friday’s action formed into a Bear candle with substantial lower shadow due to late recovery during the day. H&S possibility would succeed if Index retraces the late recovery in faster time, and breaks below Friday’s low.

Break below the Neckline would project height of the pattern, from Neckline to the Head, as a downside implication of the pattern. Such projection would calculate levels closer to Aug/Sep lows as a downside possibility.

However, protecting the “Neckline” and thereafter strength above its “Head”, i.e. last week’s high, would reject the H&S possibility and open +ve options. Such a move would also put the structure shown with Orange in jeopardy.
<<<

Read more at http://content.icicidirect.com/ULFiles/UploadFile_2016102410406.asp

Market outlook

Daily charts
- trend is up on daily charts
- markets facing resistance of falling channel
- today, markets closed flat
- AD flat, VIX up 4%

Elliott Wave Analysis Report of Nifty for 24 Oct 2016

Nifty opened mild gap at 8708 but failed to sustain at higher levels and traded with negative bias for rest of the day. Nifty declined about 50 points from day’s high to register day’s low 8652 followed by a sharp bounce before closing 6 points negative at 8693.

Friday, there was no exact trading strategy suggested because calculations were suggesting minimum target at 8727 and stoploss 8668, so there was no risk reward and even if break below 8668 then also the upside pattern will be incomplete and there were no downside targets. Overall conditions were suggesting a very narrow range where it was not safe to decide a trade in advance. And same happened on Friday, Nifty trade in narrow range of 50 points without any clear direction. Let’s have a fresh look at latest charts for further scenario.

Read more at http://sweeglu.com/elliott-wave-analysis-report-of-nifty-for-24-oct-2016/

October 23, 2016

SHape of things to come: IPHONE 10


Srinivasa Ramanujan: Encounter with the Infinite

Ramanujan commemorative postage stamp issued in India in 1962

How Did the Minimally Trained, Isolated Srinivasa Ramanujan, with Little More than an Out-of-Date Elementary Textbook, Anticipate Some of the Deepest Theoretical Problems of Mathematics—Including Concepts Discovered Only after His Death?

 ....
Hardy realizes that Ramanujan’s formulae, so weird yet elegant, supercharged with meaning yet concise, “must be true because, if they were not true, no one would have the imagination to invent them.” So disturbed is Hardy by the genius evident in Ramanujan’s letter that he sends an emissary to the edge of the empire, to India, to bring Ramanujan back to the imperial capital.

At Cambridge, Ramanujan is friendly and funny, easy company, but weird mathematics gushes out of him. He can’t explain the reasoning that leads to his formulae, nor their significance. He seems otherworldly to Hardy, as easy and dexterous with infinite quantities as with a knife and fork. With his intellect finally being fed by a university, Ramanujan’s genius erupts into something never before seen.

.... Then he returns to India, expecting to die. As his last act, he produces the strangest work of his career: a series of mathematical formulae only recently understood. We now know that they grant the bearer passage to the infinite.

Read more at http://www.believermag.com/issues/201501/?read=article_schneider_phelan
and https://en.wikipedia.org/wiki/Srinivasa_Ramanujan

October 21, 2016

BANKNIFTY weekly charts

- first higher high higher low in 5 weeks
- holding 18800 will be bullish


NIFTY weekly charts

- trend is up on weekly charts
- immediate support 8500
- low of recent bull bar has not broken so far


Market outlook

Daily charts
- trend is up on daily charts
- markets trading near upper trenline of falling channel
- today, markets were flat, AD flat, VIX negative
- option writing support 8500

October 20, 2016

Market outlook

Daily charts
- trend is up on daily charts
- rangebound movement seen for now 2 days
- markets approaching upper trendline of falling channel
- breakout from channel will be bullish
- immediate support 8500

NILKAMAL breakout... stock at lifetime high


JM FINANCIAL breakout... stock at lifetime highs


EDELWEISS up 6% on good volumes... still a buy

Your stoploss 110-90


ASHOK LEY excellent weekly chart

Stock is very close to long term supports...


TECHM at 2 year low/ long term supports


October 19, 2016

Market outlook

Daily charts
- trend is up on daily charts
- no chance in SL as 8500 remains a good support
- today markets were flat, AD positive
- expect resistance near upper end of channel
- breakout from channel will be strongly bullish

NIFTY spot trendline resistance on hourly charts

This line will act as a strong resistance... this is a part of the bigger 'falling channel' on EOD charts breakout from which will be bullish.


Staying as tenant in your own house

Overleverage kills... always and very badly. 

Expect to see proud and mighty corporates sell off their best assets.

>>>
The $13 billion deal to sell 98 percent of Essar Oil to Russia’s Rosneft, Trifigura, and United Capital Partners, announced on Saturday by the Ruias, is one more piece of evidence that India’s over-leveraged businesses are having to sell their crown jewels in order to remain afloat. It is further proof that Indian conglomerates will have to shrink before they can grow again.

A few days ago, over-leveraged Anil Ambani inked a pact to sell 51 percent of the tower assets of his telecom company Reliance Communications (RCom) to Brookfield for Rs 11,000 crore. While the deal may take some time to consummate, essentially it will convert the owner of the towers (ie, RCom) into a tenant. RCom will be using the same towers for running its network and pay lease rents. Again, a case of giving up your crown jewels to reduce debt.

In July, the Aditya Birla Group sealed a deal to buy debt-burdened Jaiprakash Group’s 17.2 million tonnes of cement capacity for an enterprise value of Rs 16,189 crore. Again, this was a case of a forced firesale. Asked why he was selling his best businesses, Jaiprakash Group Executive Chairman and CEO told ET Magazine in an interview: “In tough times only good things go. That pain of selling some of our best assets will be there for life.”

Vijay Mallya, who managed to crash-land Kingfisher in 2011, has lost not one but two of his crown jewels, United Spirits, which is now controlled by Diageo, and United Breweries, which is now controlled by Heineken. And all because he over-leveraged himself in trying to run a thin-margin vanity business like airlines using money from his cash-generating booze businesses. Folly comes in many shapes and sizes and Mallya is now unable to return to India to face the music.

<<<

Source: http://swarajyamag.com/business/how-debt-forced-ruias-to-downsize-other-conglomerates-also-in-tailspin

Bankers overjoyed with Essar Oil deal

cvbw3t1wgaaumec
The acquisition of Essar Oil by Russian firm Rosneft along with other investors has brought cheer to beleaguered Indian banks that have been bogged down by rising stressed assets over the past four years.

While loans to Essar Oil, to the tune of Rs.28,000 crore, are still seen as standard (or performing assets) in bank books, loans to Essar Steel, amounting to about Rs.35,700 crore, have been classified as non-performing by most banks.
Analysts said that this deal gave the Essar Group the opportunity to reduce debt in Essar Steel as well as in Essar Power.

On Saturday, promoters of Essar Oil sold 49 per cent of their stake to Rosneft, while Netherlands-based Trafig-ura Group and Russian investment fund United Capital Partners split another 49 per cent equity equally. The value of this all-cash deal, which includes Vadinar Port assets, was $1.3 billion or about Rs.85,000 crore.

“The key beneficiaries from the Essar Oil deal are likely to be ICICI Bank, Standard Chartered Bank, SBI, Punjab National Bank, and IDBI Bank,” Motilal Oswal Securities said in a report. “We believe NPA recognition for large accounts has peaked and expect gradual resolution hereon,” the report added.

Analysts reckon this deal could lead to the resolution of close to 10 per cent of the system’s NPAs, in a domino effect. According to RBI data, stressed assets of Indian banks rose from 9.8 per cent at the end of March 2012, to 14.5 per cent at the end of December 2015.


Interesting that the best mutual fund has returned 14.73% over 10 years

October 18, 2016

Market outlook

Daily charts
- trend is up on EOD charts
- immediate support around 8500 levels
- today markets up almost 2%
- we had excellent AD
- 7% drop in VIX benefited option writers like me
- now expect resistance around upper trendline of falling channel.

Iron condor explained for option lovers

The iron condor is a limited risk, non-directional option trading strategy that is designed to have a large probability of earning a small limited profit when the underlying security is perceived to have low volatility. The iron condor strategy can also be visualized as a combination of a bull put spread and a bear call spread.
Iron Condor Construction
Sell 1 OTM Put
Buy 1 OTM Put (Lower Strike)
Sell 1 OTM Call
Buy 1 OTM Call (Higher Strike)
Using options expiring on the same expiration month, the option trader creates an iron condor by selling a lower strike out-of-the-money put, buying an even lower strike out-of-the-money put, selling a higher strike out-of-the-money call and buying another even higher strike out-of-the-money call. This results in a net credit to put on the trade.
Limited Profit
Maximum gain for the iron condor strategy is equal to the net credit received when entering the trade. Maximum profit is attained when the underlying stock price at expiration is between the strikes of the call and put sold. At this price, all the options expire worthless.
The formula for calculating maximum profit is given below:

Hot stocks and charts

LAST updated: 17-OCT-2016 
ABAN
ABAN chart

October 17, 2016

Neowave analysis of markets

Decisive break below Aug/Sep’16 lows of 27826-717 (Nifty 8518-55) is, however, still awaited to confirm that the 3rd Corrective is indeed finally over, and downward correction to the larger “D” leg has started.

Last week’s low on Sensex was at 27548, which broke its Aug/Sep lows we had mentioned as 27628. However, Nifty’s low for the week was at 8541, which is still not broken its corresponding Aug’16 low of 8518.

Further, a break is considered as “decisive” when the action performs “lower top lower bottom” below the levels (Aug low). This is still awaited. However, this is only a matter of “decisiveness”.

....

We had also argued that a Triple Combination carries pattern implication of 60-70% retracement. We also marked the 60% implication at 25000-500 on the initial Daily chart. On Nifty, 60% retracement level would calculate as 7700-7800.

Read more at http://content.icicidirect.com/ULFiles/UploadFile_2016101711229.asp

Market outlook

Daily charts
- nifty trend is up on daily charts
- the recent swing low broke on 29-SEP but I have ignored it.
- this is because of support at 8500 and
- the fact that NF is trading in a falling channel

NIFTY Option writing trades - I

5-OCT-2016
- sold 8900 call 300 at 60
- sold 8700 put 300 at 80

Total investment approx. Rs.360,000. Max profit = 300*60 + 300*80 = Rs.42,000/-.

Nifty have Possibility to Bounce Sharply on 17 Oct 2016

Nifty opened mild gap up on Friday at 8594 and declined sharply to register day’s low 8549 but traded with positive bias later for the day. Nifty bounced gradually from morning low to register day’s high 8604 before closing 10 points up at 8583.

Friday, there was no particular trading strategy suggested but just mentioned that “I would like to buy Nifty Nov 8900 Call before closing on Friday if see Nifty below 8550” and further 8618 was suggested as point for any short term reversal and stoploss for shorts. Nifty declined below 8550 and traded below 8618 for whole day. Let’s have a fresh look at latest charts for further scenario.

Read more at http://sweeglu.com/nifty-have-possibility-to-bounce-sharply-on-17-oct-2016/

India lost 550 jobs everyday in 4 years... to lose 7 million by 2050

As many as 550 jobs have disappeared every day in last four years and if this trend continues, employment would shrink by 7 million by 2050 in the country, a study has claimed.

As per the data released by Labour Bureau early 2016, India created only 1.35 lakh jobs in 2015 in comparison to 4.19 lakh in 2013 and 9 lakh in 2011, the group said in a statement.
 The data clearly points to the fact that job creation in India is successively slowing down, which is very alarming, it pointed out.

Read more at http://www.businesstoday.in/latest/trends/7-million-jobs-can-disappear-in-india-by-2050/story/238654.html

Nice Q&A on power of componding for investors: Madhusudhan Kela

Question: In one of your tweets you said “Compound interest is the eighth wonder of the world. He who understands it, earns it...he who doesn’t..pays it. A powerful force as per Einstein.” What message do you have about people between ages 25 years and 35 years who only want to invest in debt, realty, and the likes?


No, India's Software Industry Did Not Die On Friday

Media reports about the demise of the Indian software industry are grossly exaggerated and very premature.

Let us take stock of the situation today. The Indian software export industry is about $110 billion. It employs around 4.25 million people. It has a 60 per cent market share of global outsourcing and is globally dominant. Of the 10 top software service companies globally ranked by market cap, five are Indian. Of the top five, three are Indian. All of them have a massive presence in India. Of the total number of employees, amounting to nearly 2 million, in these top 10 companies, about 70 per cent are based in India or travel out of India. The Indian offshore software industry dominates the software services world and has no parallel.

....

Some commentators have stated gleefully that the end of the industry came when the business stalled in the last quarter and because they were unable to adopt a new stack of digital technologies. These all-knowing commentators seemed to lack a fundamental understanding of the industry because they made statements that the Indian industry would not have tanked if we had been able to embrace SMAC or Social Mobile Analytics and Cloud-based technologies early. The Indian industry has done very well on the legacy side of IT services. Web-based technology, which was cutting-edge not so long ago, is also now legacy! Indian IT also has a growing practice in SMAC.

Read more at http://www.ndtv.com/opinion/no-obit-needed-our-software-industry-is-alive-and-kicking-1474789

October 15, 2016

Daydream View, VR Headset by Google

This technology will sometime in the future kill tourism completely.

INFOSYS: break of trendline support on monthly charts

Next supports 940-745-530


GOLD weekly charts

- trend is down on weekly charts
- next support 1200


US markets weekly charts

DJIA - trend will turn on close below 18000


Similar level for S&P 500 is 2100


CNX Pharma weekly charts

- index is rangebound this year
- support 10500 resistance 12000


CNX IT weekly charts

- trend is down
- next support 10000-9500
- sustaining above 10500 is bullish
- strong resistance in the 11000 area


BANKNIFTY weekly charts

- trend is up on weekly charts
- slower retracement of last 2 bull bars is a bullish sign
- support 19000-18000


NIFTY weekly charts

- trend is up on weekly charts
- rangebound movement seen for past few weeks
- support formed around 8500


October 14, 2016

Market outlook

Daily charts
- trend is up on daily charts
- after yesterday's fall, markets were flat
- AD was 2:1 while VIX showed some drop
- option writing support remains at 8500 for this series.
- watch falling channel carefully next week

Nifty Can Bounce towards 8700-8800 from 8550-8393 Range

Nifty opened gap down today at 8671 followed by sharp decline and traded with negative bias for rest of the day. Nifty declined by more than 150 points to register day’s low 8541 before closing huge 135 points down at 8573.

Yesterday, trading strategy was to Buy Nifty in 8694-8681 range using exact stoploss of 8663 expecting targets 8781 but Nifty opened at 8671 and declined below 8663 within fraction after opening, so trade was negated. Nifty declined as per alternate possibility of the sharp decline (small crash) mentioned in the report. Let’s analyze fresh charts for further scenario.

Read more at http://sweeglu.com/nifty-can-bounce-towards-8700-8800-from-8550-8393-range/

October 13, 2016

Market outlook

Daily charts
- trend is up on daily charts
- today, markets were down 1.6%
- AD negative; VIX up 8%
- put writing support 8500
- see falling channel - bullish implication.

October 11, 2016

US markets continue to correct?

See chart... triangle likely broken... if true, this means recent lows will also break.

Why "likely"... because bar . i.e. trading day is not complete.


Sunita Williams - tour of the International Space Station

Recommended for technology/ space buffs and aspiring engineering students. By NASA.

The ISS is almost the length of a football ground and consists of several modules and submodules attached over a period of time.

Enjoy the internal video tour by Sunita Williams. Note that there is no up or down in ISS.

Read more about the International Space Station.

Neowave outlook of market

Could not understand anything...

Read more at http://content.icicidirect.com/ULFiles/UploadFile_20161010112031.asp

Trading is all about probabilities and discipline. Nothing else.


October 10, 2016

Which people trust their governments? See where India is... you will be surprised!

culqovgxeaa6umu


India is not at the bottom... it is in the top 5!

And our neighbors do not figure in the list at all.


Market update

Daily charts
- trend is up on daily charts
- weekly close below 8500 will trigger reversal
- today, markets were flat, AD positive
- option writing support 8500 resistance 9000

Soyuz docking, reentry and landing explained - for the space enthusiast

Elliott Wave Outlook of Nifty for 10 Oct 2016 Onward

Nifty opened mild gap up on Friday at 8721 but failed to sustain at higher levels and traded with negative bias for rest of the day. Nifty declined to register day’s low 8664 before closing 11 points down at 8697.

Friday, trading strategy was to Buy Nifty only if touch 8732 with stoploss of 30 points otherwise wait for identification of any other pattern to initiate trade. Nifty failed to break above 8731 on Friday and trade didn’t activate. Let’s have a fresh look at latest charts for further scenario.

Read more at http://sweeglu.com/elliott-wave-outlook-of-nifty-for-10-oct-2016-onward/

Lost 90% in a stock? Your Portfolio Might Still Beat The Nifty

A blind purchase of all stocks in the Nifty 10 years ago still beat the returns of the Nifty. But obviously we can’t say this happens all the time; we’d have to test different time frames (10 years, 5 years etc) and different start and end points). This is not the point we want to make.

The point is: Most of your money was made in the big winners – so much that they overrode the losers, to even beat index returns in the meantime. So when some stocks go to zero, don’t fret!
  • Three stocks lost over 80% in absolute terms.
  • Three more stocks lost more than 40%.
  • A Further five other stocks saw their stock prices contract (sub-zero-percent returns) in the last 10 years.
  • That’s 11 stocks out of 50 that gave you returns lower than zero!
  • And yet, you beat the index.

October 9, 2016

Rise of the machines: How cars are built

Paratroopers Static Line Jump From C-17

I am crazy about aviation... this is a video of a line jump from C-17 (US Air Force)

For aviation buffs... live air traffic site

This is a site I see every now and then. I have a deep fascination for aircrafts and the people who fly them.

This is how the sky looks above Mumbai at the time of this writing.

The plane positions refresh every few seconds...


But it is daytime in New York and this is how the sky above JFK looks like:

Risk, fear and worry are not the same

Risk is all around us. When we encounter potential points of failure, we’re face to face with risk. And nothing courts risk more than art, the desire to do something for the first time–to make a difference.

Fear is a natural reaction to risk and exists only in our imagination. Fear is the workout we give ourselves imagining what will happen if things don’t work out.

Worry is the hard work of actively (and mentally) working against the fear. Worry is our effort to imagine every possible way to avoid the outcome that is causing us fear, and failing that, to survive the thing that we fear if it comes to fruition.

If you’ve persuaded yourself that risk is sufficient cause for fear, and that fear is sufficient cause for worry, you’re in for some long nights and soon you’ll abandon your art out of exhaustion. On the other hand, you can choose to see the three as completely separate phenomena, and realize that it’s possible to have risk (a good thing) without debilitating fear or its best friend, obsessive worry.

Separate first, eliminate false causation, then go ahead and do your best work.

Manage stoplosss and be a liberated trader

Once you’ve mastered putting in protective stops, you’ll feel empowered. Why? Because at that point you are emotionally balanced and are WILLING to transfer the risk to someone else and exit with a small loss. You have emotional and financial understanding that trading is a process and that any one trade is meaningless over 1,000s of trades.

At that point you have personal power in that trading is just one part of your day and your life is abundant. And you don’t need to tell anyone about your trading. You’re in love with your process – be it mechanical or discretionary – and not in love with any one particular trade.

At that point, you’ll also realize that you can’t really speak to anyone about trading anymore. Most amateurs don’t understand that trading like a professional requires a combination of self-awareness, emotional intelligence, and some level of technical proficiency.

You won’t be able to communicate with such a person as they are speaking one language and you another. They are ignorant about your expertise and necessary behavior. It’s a dialect all its own and it’s unique to you and only you.

This ability is learned behavior – but most will never achieve this level because they are focused on the wrong principles. They’re missing the 80% of the puzzle that is most significant.

Expectancy, your edge and probability

You have to do the mental work to let go of the need to know what is going to happen next or the need to be right on each trade. In fact the degree to which you think you know or in any way need to know what is going to happen next, is equal to the degree to which you will fail as a trader.

The most successful traders have found a way to inoculate themselves from the stress of trading, and from the outcome of their most recent trades. Here’s how they do it:

They have an unshakable belief in the fact that

1) While the outcome of any given trade is uncertain they believe in their edge over a series of trades. In other words they know the expectancy of their method and have confidence that over a series of random outcomes, the odds are in their favor.

2) Anything can happen! In other words they have learned to think of every trade like tossing a coin – they don’t need to know what will happen. They don’t expect to either win or lose. This firm belief in the uncertainty of any given trade, while knowing that over a series of trades you will be profitable, is very liberating.


Interesting quote

wc2

October 8, 2016

Pen Apple Pineapple Pen

A short wierd funny song which has the taken the internet by storm and has crossed 47 million views in just a few weeks.

Increase the volume and enjoy... it is less than a minute long.

Good for tiny tots, kids, adults and probably anyone who wants to destress!

October 7, 2016

Rise of the machines: A320 landing in zero visibility thanks to autopilot


Weekend short film - destressing - VICKY ... < 10 min


NIFTY weekly chart

- NIFTY traded within high low of previous week
- good support around 8480-8500 levels
- below this, faster fall possible
- next support 8300-8000


BANK NIFTY weekly chart

- trend is up
- signs of selling at higher levels
- support 19000 resistance 20000


Market outlook

Daily charts
- trend is up on daily charts
- expecting correction below 8500 only
- today, markets were flat, AD flat
- option writing resistance 9000


Merchant bankers, investment advisers, research analysts to get permanent registration

To facilitate the ease of doing business, Sebi today decided to provide permanent registration to merchant bankers, investment advisers, research analysts and eight other categories of market intermediaries.

The Securities and Exchange Board of India (Sebi) already gives permanent registration to stock brokers and sub-brokers subject to their compliance with certain requirements.

The proposal to grant permanent registration to 11 more categories of market intermediaries was cleared by Sebi’s board during its meeting here today.

October 6, 2016

Sensex Exit Candidates 2015-16

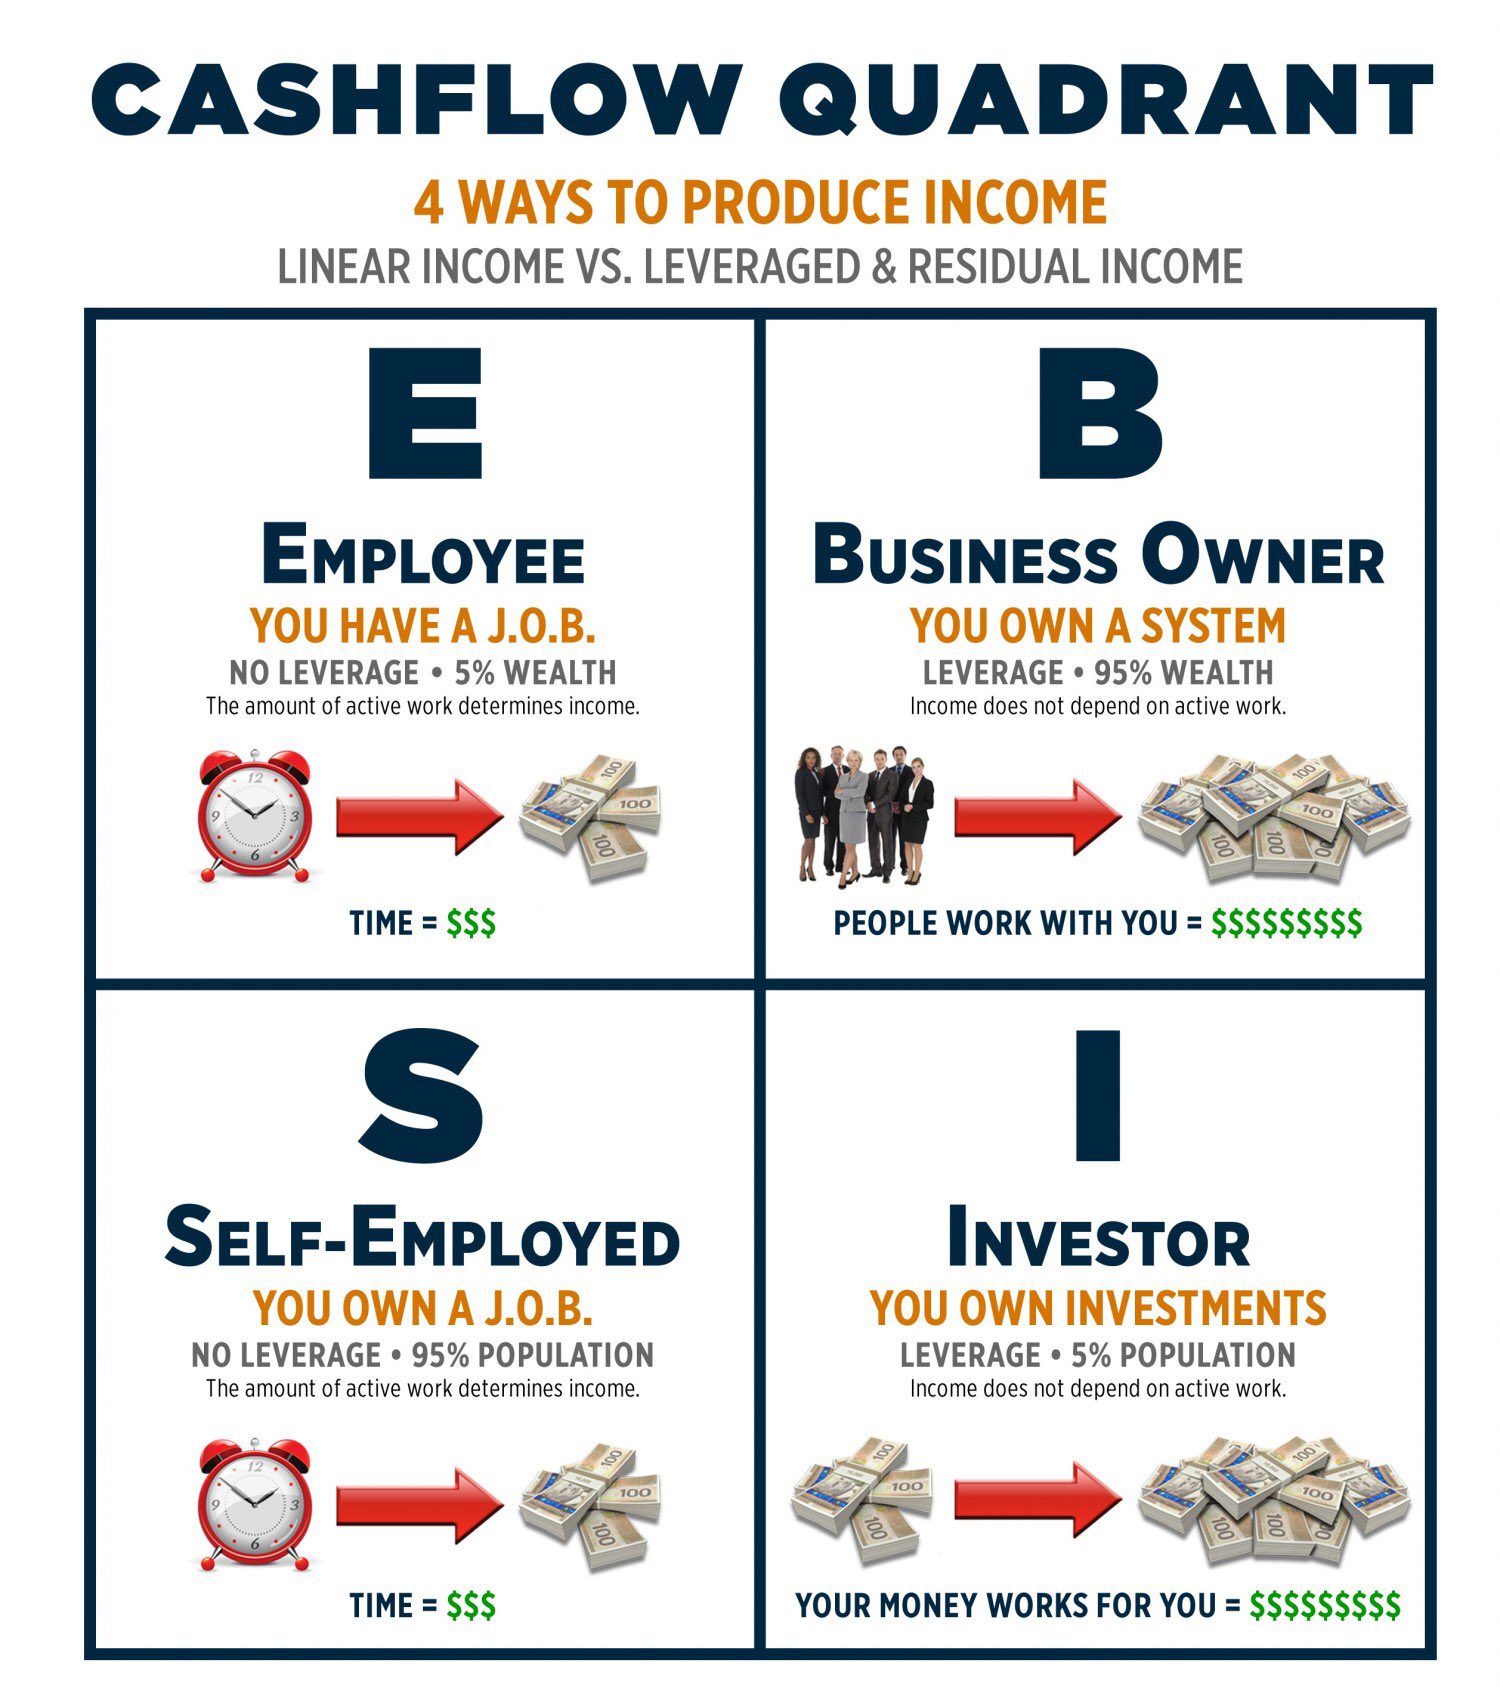
4 ways of income generation / linear income vs leveraged income


Ultra frugal billionaires

Market outlook

Daily charts
- trend is up on daily charts
- markets trading in a range for some time
- today markets closed in negative; AD negative.
- call writing resistance at 9000


HCL Info up 12% to @ Rs 51 with super volumes - Will BSE & NSE ask Why again?

HCL Infosystems Ltd up 12% to @ Rs 51 with super volumes ~ Will BSE & NSE ask Why again?

Just under a fortnight ago on September 22,2016 HCL Info opened at @ Rs 42 & surged to Rs 48 before settling at Rs 47 on huge above average volumes with BSE clocking over 42 lakh shares and NSE  trading near 1.63 cr shares

BSE & NSE had asked the Company to Clarify on whether there was any reason for this surge in Volumes & Share Price

Interestingly the Company replied instantly that “The increase in volume seems speculative in nature”  

The Delivery % was just under 20.

The Share Price then slid last week back to Rs under 43

Today  BSE  & NSE clocked even more super volumes exceeding 45+ lakh & 1.84+ cr  shares respectively with Share Price shooting up 12% to close just under Rs 51

What’s Happening? Will the Exchanges in 13 days yet again ask the Company for clarification for today’s surge too & will the company reply the same that it’s seems to be speculative & will thus the share price slide back ?

Read more at http://www.gauravblog.com/hcl-info-up-12-to-rs-51-with-super-volumeswill-bse-nse-ask-why-again

October 5, 2016

Market outlook

Daily charts
- trend is up on daily charts
- today markets closed in negative but AD was positive
- some selling/ lack of buying seen at higher levels
- option writing support 8600 and resistance 9000

Automation threatens 69% jobs in India: World Bank

Automation threatens 69 per cent of the jobs in India, while 77 per cent in China, according to a World Bank research which has said that technology could fundamentally disrupt the pattern of traditional economic path in developing countries.

“As we continue to encourage more investment in infrastructure to promote growth, we also have to think about the kinds of infrastructure that countries will need in the economy of the future. We all know that technology has and will continue to fundamentally reshape the world,” World Bank president Jim Kim said.

“But the traditional economic path from increasing productivity of agriculture to light manufacturing and then to full-scale industrialisation may not be possible for all developing countries,” Mr. Kim said in response to a question at the Brookings Institute during a discussion on extreme poverty on Tuesday.

Similar news:

GOLD breaks support

Big crack in GOLD yesterday as it breaks support.

Now this support 1310 will offer resistance.


Elliott Wave Outlook of Nifty for 05 Oct 2016 Onward

Nifty almost achieved minimum target 8800 expected after break above 8689 in my previous analysis report Elliott Wave Analysis Report of Nifty for 03 Oct 2016 Onward. This analysis report is further update of my previous analysis as action expected in previous report is already happened.

Nifty opened gap up at 8770 and declined gradually towards 8740 followed by sharp swings between 8780-8740 later in the day. Overall it was a range bound day with volatility and finally Nifty closed 31 points up at 8769 after registering day’s low 8736 and high 8783.

Yesterday, more upside towards 8800 was expected and longs taken at 8689 were advised to hold with immediate / Intraday stoploss of 8718 whereas positional stoploss for all longs was 8665. Further I advised to book 50% longs in 8780-8800 range and hold rest with stoploss of 38% retracement of wave (3). Nifty bounced further to register day’s high 8783 without triggering immediate stoploss of 8718. Let’s have a fresh look at latest charts for further scenario.

Read more at http://sweeglu.com/elliott-wave-outlook-of-nifty-for-05-oct-2016-onward/

Patel’s Big Day Out Signals Abrupt Shift From Rajan’s Era

It was meant to be independence day for India’s central bank. It might instead be viewed as mission accomplished for Prime Minister Narendra Modi’s government.

With a new governor at the helm of a newly-minted Monetary Policy Committee, the bank had the opportunity Tuesday to buttress the autonomy over interest-rate decisions that former leader Raghuram Rajan fought for. With the economy growing in excess of 7 percent, most economists predicted no change in the benchmark.

Instead, Reserve Bank of India Governor Urjit Patel surprised many with a rate cut, signaling that faster expansion has become the priority even as inflation remains stubbornly higher than in the rest of Asia. Three government-appointed economists and two RBI colleagues joined Patel in a 6-0 vote in favor of the quarter-point move. They acted hours after a top bureaucrat highlighted the government’s view that inflation is receding.


Read more at http://www.bloombergquint.com/business/2016/10/04/patel-s-big-day-out-signals-abrupt-shift-from-rajan-s-stormy-era

October 4, 2016

I did not know there was a rate cut today

But then, why did markets give us a doji?

The markets should have blasted since rate cuts are supposedly what the economy requires.


Market outlook

Daily charts
- trend is up on daily charts
- today, markets traded in a small range (doji)
- close was positive, AD flat, VIX down 4%

Dilbert Creator Scott Adams "Shadowbanned" From Twitter After Trump Support

Following a blog post daring to discuss how "dangerous" Donald Trump was compared to Hillary Clinton... (excerpt below)

Is Twitter Inc Rigging The US Elections?

Twitter implemented its new algorithmic timeline in February, and since then, libertarians, anti-establishment dissidents and conservatives have all been waiting for the micro-blogging firm to interfere in the current U.S. election cycle. Now it seems there is clear evidence of that happening, says Breitbart.

Why is Twitter doing this?

Nearly two months ago, Breitbart Tech editor Milo Yiannopoulos predicted that Twitter would seek to interfere with the primary election process. Twitter’s head of news, elections and government served as a deputy chief of staff for a Democrat senator from Louisiana in 2008 and was a term member of the Council of Foreign Relations. This could have some connection with Trump’s tweet disappearing.

“A move to shadowban the tweets of the Republican front-runner would therefore not entirely be unexpected,” the website says.

Read more at http://www.valuewalk.com/2016/04/twitter-rigging-elections/

October 3, 2016

FTSE at lifetime high after Brexit

Infographic: India vs China vs US

Market outlook

Daily charts
- trend is up on daily charts
- today markets up 1.47%
- AD was strongly positive; VIX down 9%
- option writing support 8600 resistance 9000.

Neowave analysis of markets

Thursday’s sell-off was fast & furious after the news of border tensions hit the market. Structurally, it raises question whether the fall from Monday to Wednesday was “d” and recovery till Thursday’s morning was “e” of the Triangle we assumed inside 3rd Corrective.

Remember, Triangle is a 5-legged pattern wherein legs in both directions “contract”. As can be checked on the chart, in one direction, e was smaller than “c” and “c” was smaller than “a”. On the other direction, “d” was smaller than “b”. (e < c < a in upward direction and d < b in downward direction).

Thursday’s fall broke the b-d line of the Triangle (NEoWave 1st stage confirmation that Triangle is over), and also retraced “e” leg in faster time (which generated NEoWave 2nd & final stage confirmation).

If true, then the 3rd Corrective is completed as a 5-legged a-b-c-d-e Triangle as marked on the charts.

We had warned that as per NEoWave, 3rd is the last Corrective of any Complex Corrective development involving x-waves. This also means even the larger “D” leg from Feb’16 may also been completed.

The NEoWave pattern implication for Triple is 60-70% retracement. So, if 8-monh long “D” leg from Feb’16 (22495/6826) to Sep’16 (29077/8969) is completed, then Index can drop to at least 25000-500 (Nifty 7700-7800) levels, which is around 60% retracement level to “D” leg.

Read more at http://content.icicidirect.com/ULFiles/UploadFile_2016103113810.asp

Elliott Wave Analysis Report of Nifty for 03 Oct 2016 Onward

Nifty opened mild lower at 8581 followed by a decline to register day’s low 8555 but bounced from lower levels and traded with positive bias for rest of the day with volatility. Finally Nifty closed 19 points up at 8611 after registering day’s high 8636.

Friday, I expected a pause or small bounce or sharp recovery towards 8800 but didn’t suggest any exact trade because bottom range based on the pattern was very big to calculate any safe and small stoploss. I just advised to avoid fresh selling as small or big recovery was expected. Let’s have a fresh look at latest charts for further scenario.

Today I am covering the move after 2016 high 8968 only as there is some confusion in the pattern of previous waves which further making it difficult to identify short term moves. We will ignore previous waves for time being and will focus on very short term pattern only.

Read more at http://sweeglu.com/elliott-wave-analysis-report-of-nifty-for-03-oct-2016-onward/

Share this...